
Articles
| Name | Author | |
|---|---|---|
| CASE STUDY: Improved change management capabilities for Infotel’s Orlando© | Alban Biard, General Manager, Orlando© Suite for TechPubs | View article |
| WHITE PAPER: How to capitalize on AI in aviation maintenance | Cameron Byrd, CEO and Founder, AIXI | View article |
| CASE STUDY: More than paperless: electronic logs delivered efficiency and integration at Air Europa | Francisco de Borja Mas Boned, Juan Miguel Sánchez García and Enrique García-Arcicollar, Air Europa | View article |
| CASE STUDY: Helvetic Airways Moves Beyond Paper Technical Logs | Christian Suhner, Chief Technology Officer (CTO) / Head of Flight Operations, Helvetic Airways | View article |
| CASE STUDY: Atlas Air transforms tech platform to optimize real-time data capabilities | Richard Steer, VP Technical Operations and Austin Wentworth, Director, both at Atlas Air, and Jim Buckalew, CEO, AeroATeam | View article |
| CASE STUDY: American Airlines optimizes maintenance scheduling | Joseph Kunnathusseril, Senior Manager – Aircraft Base Planning, American Airlines | View article |
CASE STUDY: Atlas Air transforms tech platform to optimize real-time data capabilities
Author: Richard Steer, VP Technical Operations and Austin Wentworth, Director, both at Atlas Air, and Jim Buckalew, CEO, AeroATeam
Subscribe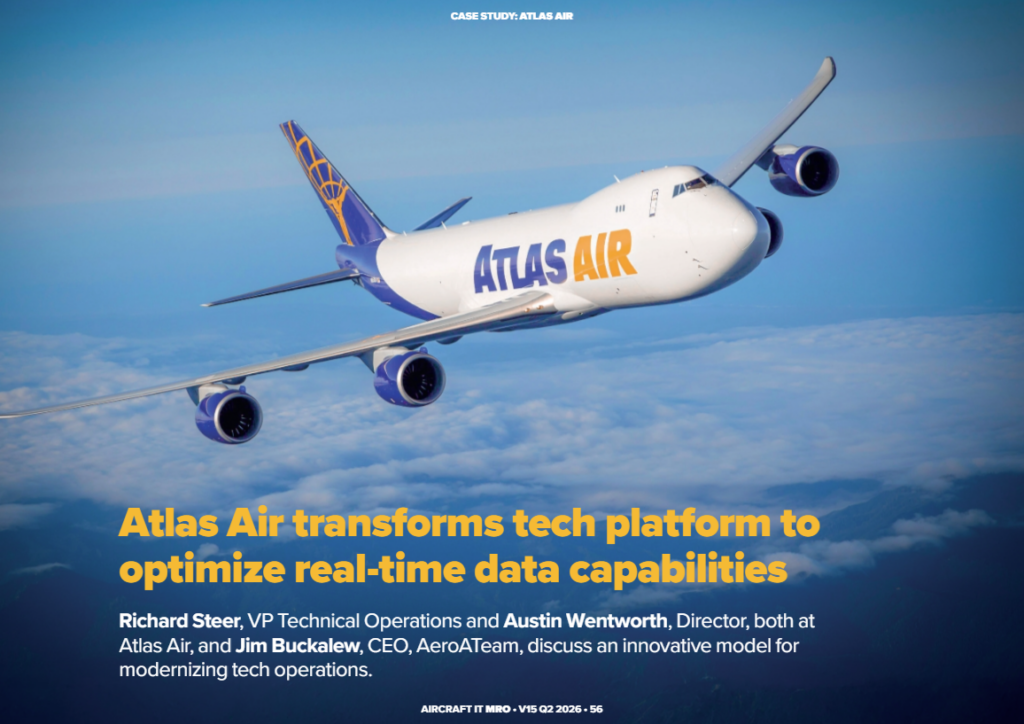
Richard Steer, VP Technical Operations and Austin Wentworth, Director, both at Atlas Air, and Jim Buckalew, CEO, AeroATeam, discuss an innovative model for modernizing tech operations.
As a large global freight operator, Atlas Air needed to transform by optimizing its people, processes and ways of working. This case study shows how the introduction of production PODS (Predictive Operations and Decision Support) has modernized the airline’s technology platforms using real-time data capabilities and advanced analytics.
Richard Steer
Our 113-strong aircraft fleet comprises mostly Boeing 747s, supporting customers in 80 countries around the world (figure 1). We carry mainly freight but also have some passenger movement. Our operation is quite large, with 59,000 flights to around 330 airports, with a Global Command Center in Erlanger, Kentucky.
Figure 1
MULTIPLE OPERATIONAL CHALLENGES
We were reliant on a legacy-based operation with multiple paper-based activities, so we were ripe for the opportunity to become nimbler and leaner. As well as needing better metrics, scorecards and dashboards from our technology, we faced operational challenges in our network.
As an example, too many people authored work packages each night. This caused confusion at the floor or station level as to what type of work was being done, especially as around 90 percent or more of our work (depending on the location) is outsourced. It meant that we were not prioritizing maintenance contract work or tightly measuring it, as a result of which we were delivering a less-than-stellar performance.
Miami focus
We undertook a proof of concept and a rollout of the new process at Miami Airport (figure 2) because the change in the marketplace for us dramatically shifted as a result of trade tariffs in 2025. Many of our customers are based in China and we move freight around the world, with much of it destined for the US. When taxes and tariffs were imposed, it became cost-prohibitive for a lot of goods to go to the US.
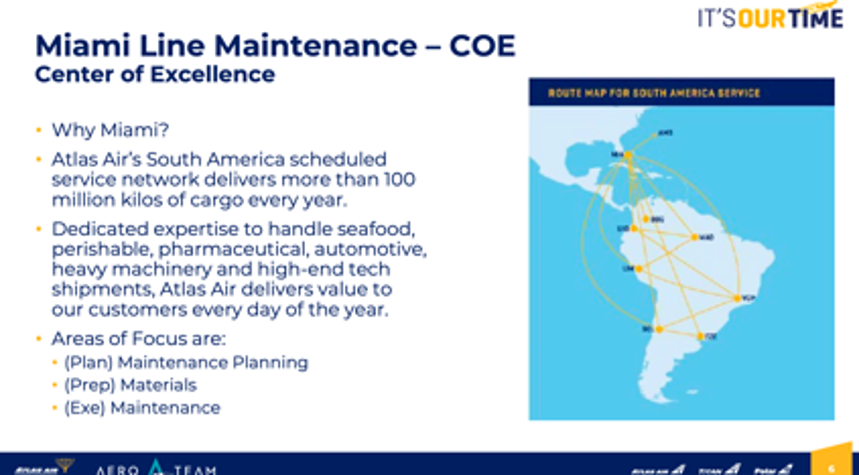
Figure 2
Inevitably, new markets started to emerge after the imposition of tariffs, especially in Central and South America, so we had to adapt to satisfy customer demand, where we are often expected to be able to ‘turn on a dime’. Our legacy-based system didn’t allow us to do that.
REGAINING CONTROL
One of the things that we wanted to do immediately was introduce production PODS to give us greater control of maintenance workflows (figure 3). We focused on the three aspects vital to our success (understand your work, flow your work, and flow your people over the work) so we could prioritize work more effectively and efficiently at the PODS.
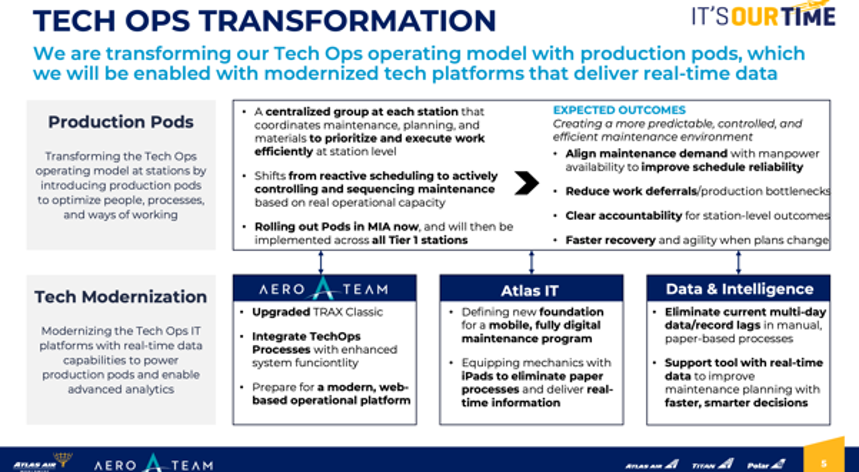
Figure 3
We were also keen to ensure that the amount of work we put into the stations was being consistently accomplished. Part of our challenge is having aircraft that fly for multiple days as we are not a ‘hub and spoke’ type of carrier; instead, we tend to ‘daisy chain’ our flights depending on customer needs. In the past, we were accomplishing around 60 percent of the desired work package, which was not acceptable. After a few months using the production PODS, this had risen above 80 percent. We leveraged our relationship with AeroATeam to make this happen. In effect, the firm has ‘springboarded’ us forward from the legacy version of TRAX software to a modernized web-based TRAX platform.
Jim Buckalew
AEROATEAM APPROACH
Every airline has a unique way of achieving its goals, and a ‘one size fits all’ software solution isn’t always the answer. We were glad to continue working with Atlas after the TRAX upgrade in finding ways of using TRAX more effectively (figure 4).
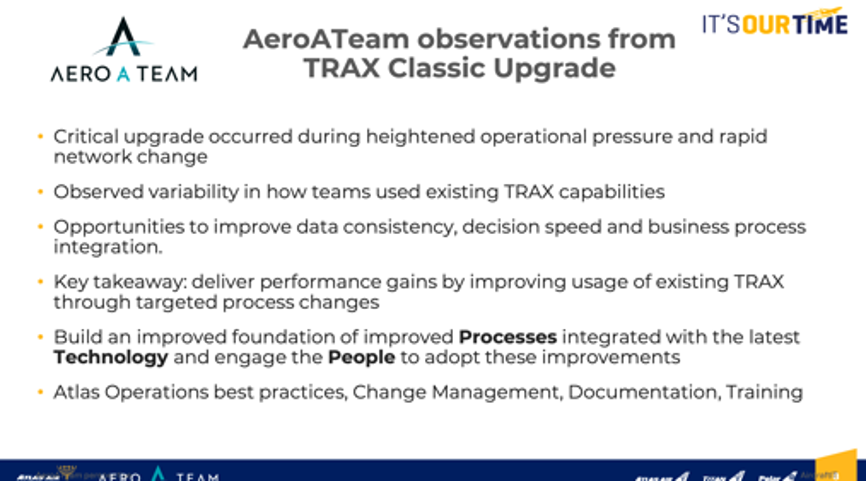
Figure 4
While carrying out the upgrade, we observed opportunities and together adjusted processes and training to be more streamlined and consistent. It has been a great reset with the technology springboard driving innovative solutions.
Austin Wentworth
PRODUCTION PODS
The adoption of the production PODS allowed us to adopt best practices in production control for a heavy maintenance environment, which is very structured and predictable, with measurable outcomes. We are applying an operations tempo typically found in line maintenance across all five key areas (figure 5). A significant improvement has been the outcome in maintenance planning. Typically, we would send out work orders from each department, so they might be coming from engineering, maintenance planning and maintenance control. Now, we can ensure that all those teams work together with one work order.
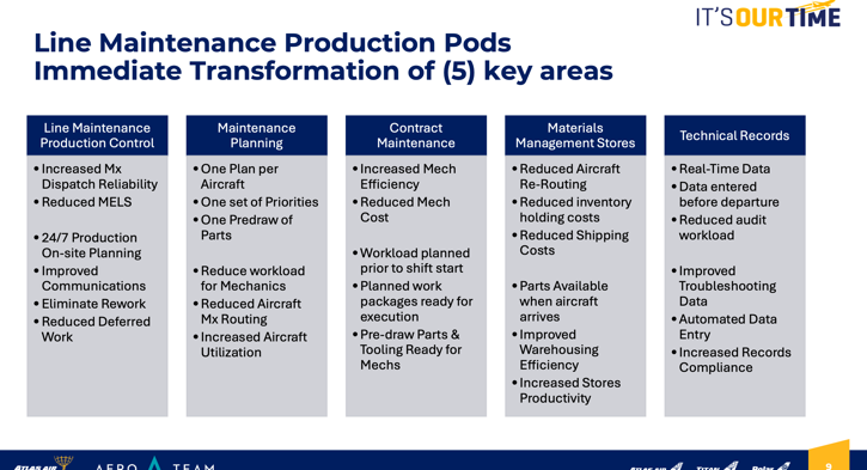
Figure 5
Next, we looked at the prioritization of work. We no longer leave that up to the individual contributor on the flight line to determine what has priority, as they are likely to opt for the MOE (Maintenance Organization Exposition) that expires soonest. We make sure prioritization comes from a leadership level and is communicated clearly to the teams. With the production PODS, we look at workloads three days in advance. It’s not uncommon for our planes to leave a base and fly for 14 days straight. So that means either you’ve got to action work if the MEL (Minimum Equipment List) comes open in the first couple of days, or you have to handle it downline, when the aircraft comes back to base. We make sure we route materials ahead of time to get them to the right place.
Jim Buckalew
SINGLE WORK ORDERS
Moving to a single work order required targeted changes within TRAX to create a more integrated and controlled maintenance environment. Atlas expanded the use of pick lists, parts reservations, and forward-looking material planning to ensure each work order is fully provisioned before execution. A real-time interface captures live inputs from the Technical Records POD, providing immediate visibility into work status and data integrity.
This approach is enabled through the Production POD model (figure X), aligning all activity under one plan, one work order. Planning, materials, and execution are synchronized; work is prepared in advance, centrally coordinated, and executed with no wasted motion at the aircraft.
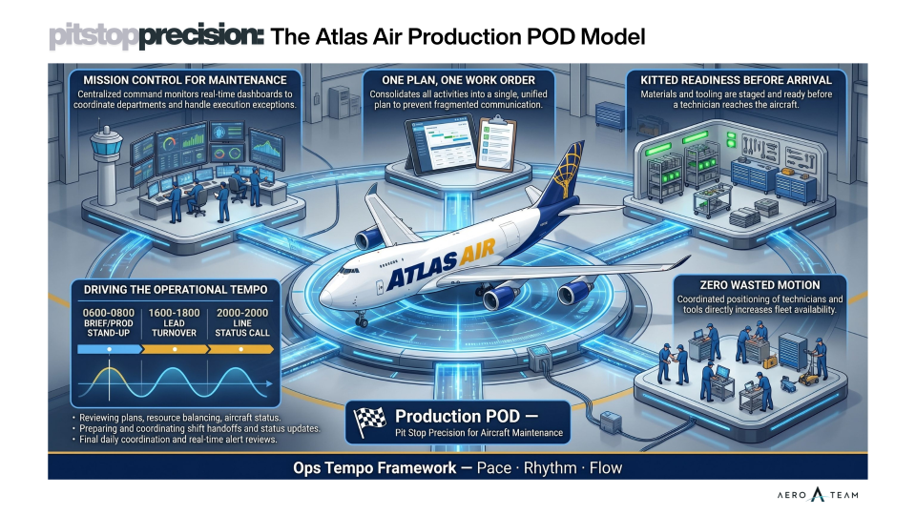
Figure 6: Production POD Model – Pit Stop Precision for Aircraft Maintenance. Visual developed by Shauna Leblond.
With 24/7 maintenance control, centralized planners in Miami coordinate priorities, materials, and execution across the network while supporting smaller stations. The result is a single-threaded workflow that improves completion rates, reduces rework, and increases operational reliability.
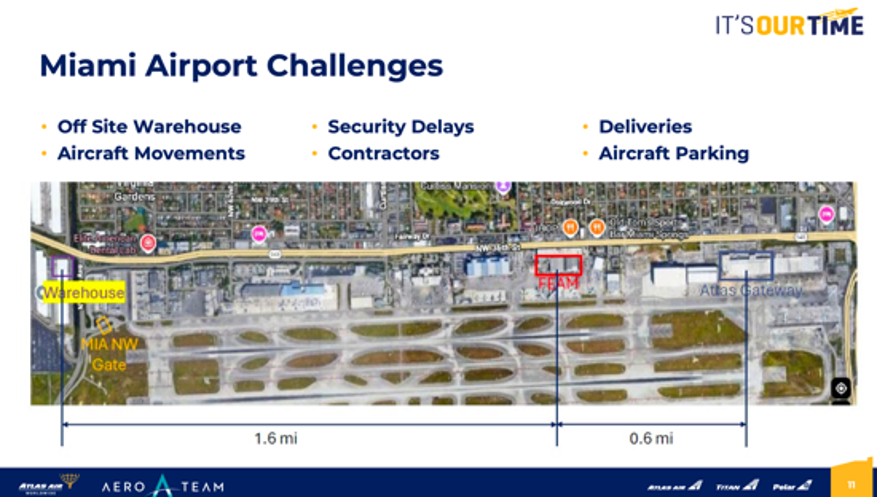
Figure 9
PRIORITIZING WORK
In looking at priorities, one of the main things we pushed was on P2 items that we wanted to elevate to a Category C. You’ll see in figure 10 that there are five days remaining, so basically 50 percent, but we wanted to bring that up in priority if no troubleshooting has been accomplished. So, while you may still see yield there, if we haven’t identified what materials we need, we wanted to make sure that that got moved up on the work plan.
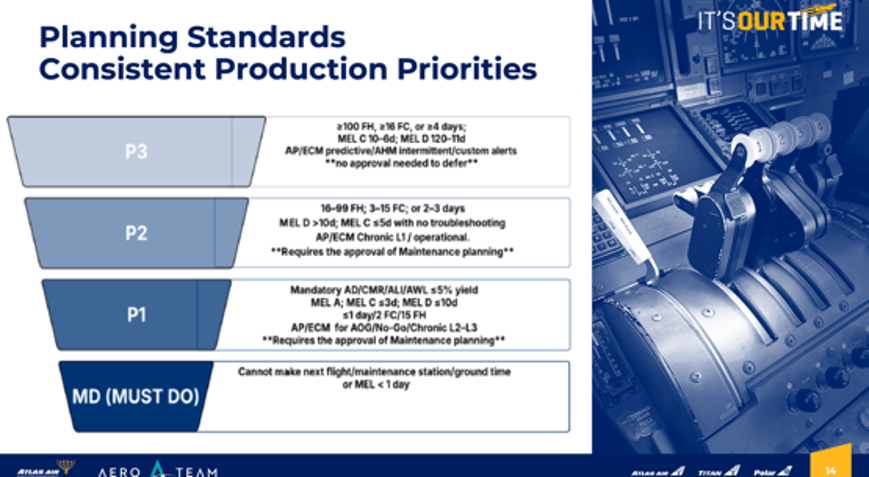
Figure 10
POSITIVE RESULTS
We are very pleased that Miami now accomplishes around 85 percent of planned work, compared with 50-60 percent in the past. The grey line in figure 11 is a 30-day moving average, and the colored line is a 10-day moving average. When half the work didn’t get done, it had to be re-planned, which is the most expensive part.
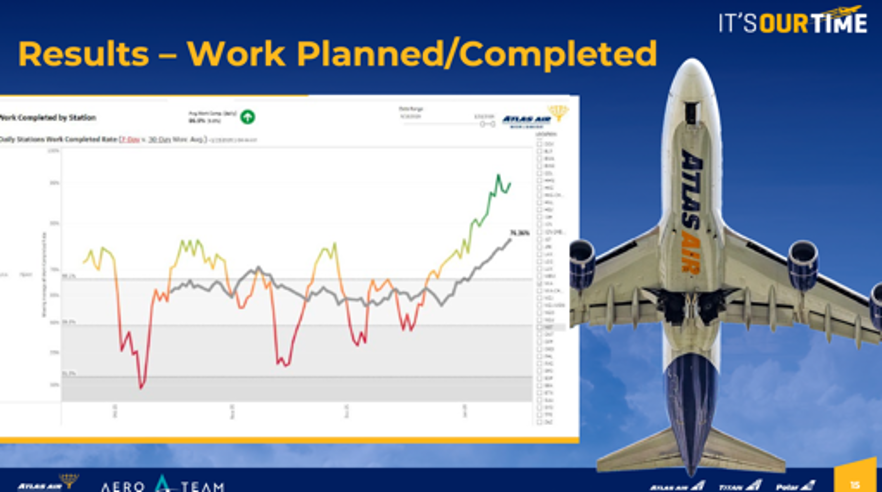
Figure 11
Richard Speer
LOOKING AHEAD
Our rollout plan (figure 12) shows that the heavy lifting has been in Miami because we are having to build all the SOPs (Standard Operating Procedures) and the manuals for this. The AeroAteam helped us write the SOPs, and the first run at it was about 95 percent to 98 percent there. It has been very refreshing for us because they are experts in this field.
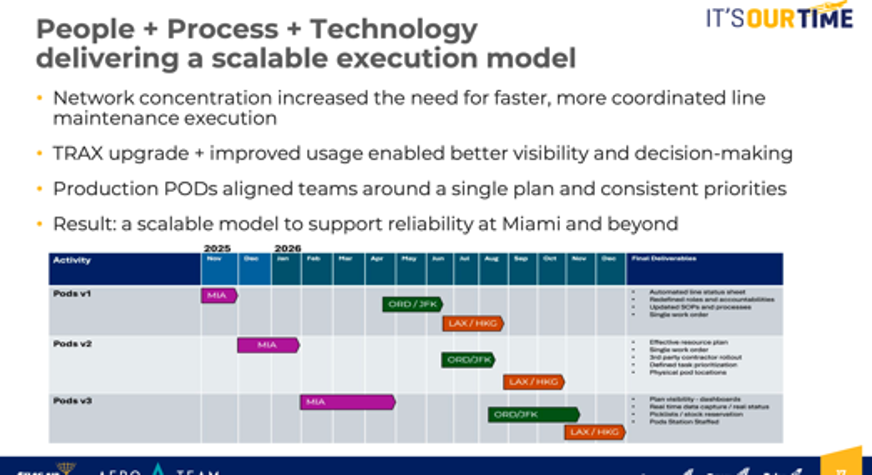
Figure 12 The rest of our rollout plan during 2026 will see Miami as the primary test subject, followed by much shorter rollouts for Chicago, John F Kennedy in New York, Los Angeles and Hong Kong.
Comments (0)
There are currently no comments about this article.
To post a comment, please login or subscribe.