
Articles
| Name | Author | |
|---|---|---|
| CASE STUDY: Launching an electronic logbook at easyJet | Philip Hyde, Implementation Project Manager, easyJet | View article |
| CASE STUDY: A change for the better at World2Fly | Alvaro Coromina Sanz, IT and Innovation Director, World2Fly | View article |
| CASE STUDY: Digitalizing Scheduled Maintenance: WestJet’s Production Control success story | James Homeniuk, Manager eMRO Platform, WestJet | View article |
| CASE STUDY: from data silos to insight | Andres Kjerulf, Director of Airworthiness, Texel Air | View article |
| CASE STUDY: From prediction to action at KLM Cityhopper | Robin Duteweerd, Fleet Manager, KLM Cityhopper | View article |
CASE STUDY: From prediction to action at KLM Cityhopper
Author: Robin Duteweerd, Fleet Manager, KLM Cityhopper
Subscribe
Robin Duteweerd, Fleet Manager at KLM Cityhopper, chronicles how the airline has turned data-driven defect analysis into proactive maintenance decisions
An important resource for ensuring that maintenance is effective, that AOGs (Aircraft on Ground) are minimized and for supporting predictive maintenance is defect reporting and analysis. Working with Veryon, KLM Cityhopper has implemented a better solution to get to grips with defect reporting and data driven analysis and that, plus some insights from predictive maintenance, is what I want to share with you in this article. But first, I’ll introduce you to the airline.
KLM CITYHOPPER
KLM Cityhopper, a wholly owned subsidiary of KLM Royal Dutch Airlines, is a feeder airline for KLM with our main hub at Amsterdam, Schiphol Airport. We aim for a 35-minute turnaround time (TAT), including cleaning, with boarding via one door. The all-Embraer fleet comprises 17 Embraer E175s and 18 E190s, soon to be 15. There are also 25 of the newest Embraer E195 E2, plus ten aircraft on order. Figure 1 shows the extent and coverage of the network.
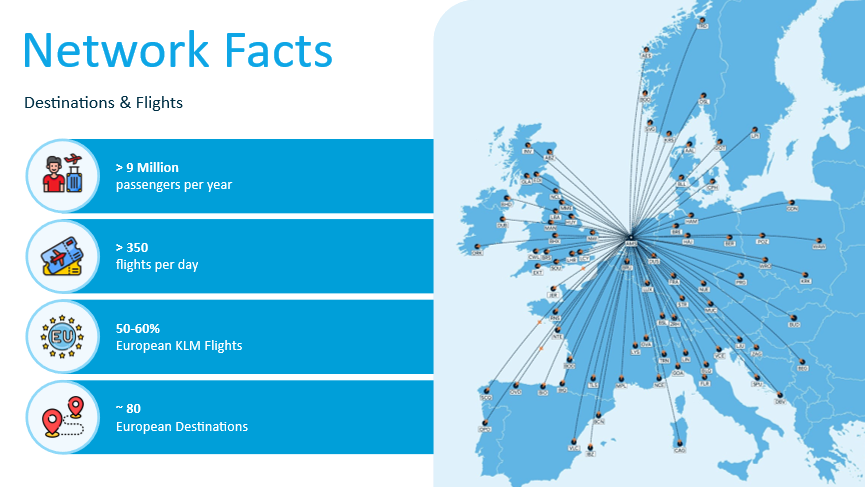
Figure 1
Less than 15 percent of our fleet will be at base overnight; the rest will be on outstations, which limits opportunities for aircraft maintenance and, at Schiphol, that 35-minute turnaround time makes maintenance a challenge.
The key issue that prompted this particular program is that, while our fleet is all Embraer aircraft types, two thirds of our outstations do not have Embraer aircraft support. So, if an aircraft becomes AOG at an outstation, we have to send mechanics and parts from Amsterdam and try to fix the aircraft in situ, which costs a lot of time. We also have unexpected interruptions, delays, cancelations, etc. With the predictive maintenance project, the goal is to reduce unscheduled ground time at outstations.
Of our maintenance providers shown in figure 2, Regional Jet Center is our biggest and main line maintenance organization based in Amsterdam.
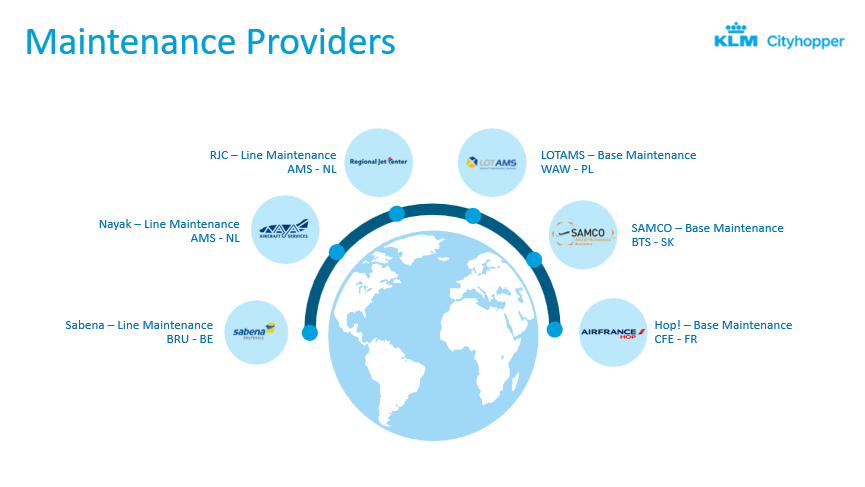
Figure 2
Nayak Line Maintenance also performs some of our maintenance at Schiphol and we have Sabana Line Maintenance for line maintenance and intermediate checks while, for base maintenance, we do a lot with AMS in Warsaw, some with SAMCO, and some base maintenance checks at Hop! – Base Maintenance in France.
PREDICTIVE MAINTENANCE
With preventive and predictive maintenance, we want to predict and prevent upcoming failures, as shown in figure 3, and determine aircraft system health so that we can be more in control of our maintenance.
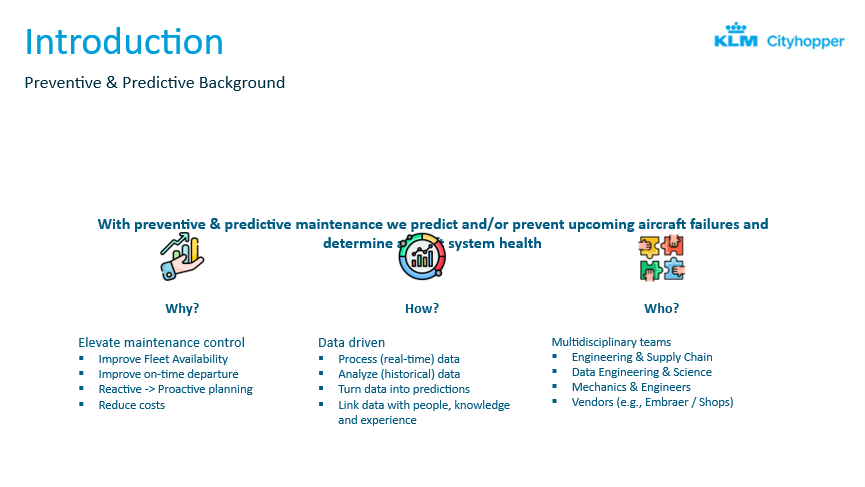
Figure 3
We wanted to improve fleet availability and on-time departure plus move from reactive to proactive maintenance. It means that we can order parts in advance, allocate an aircraft to a certain slot in advance. Ultimately, the main goal is to reduce costs related to unscheduled ground time and operational disturbances.
The solution is data-driven; we want to process near real-time data, and that means we want to process all the data that we have available from the aircraft and from our maintenance system. We want to know the history of the aircraft from a maintenance perspective, but also all the sensor data, fault codes and even weather data to determine the degradation of an aircraft’s system. We process and analyze all that data, and we also need a lot of historical data. By doing that we turn data into predictions and link the data with the people’s knowledge and experience, because you need people with experience to identify predictive patterns in aircraft failures.
Multidisciplinary teams that we run within predictive maintenance include KLM Cityhopper Engineering, supply chain, data engineering and data science. We also use the mechanics and engineers from Regional Jet Center to provide knowledge and experience. Because we don’t build the aircraft, we also need the vendors with their knowledge about components and we need Embraer, of course, as the design holder of the of the aircraft.
Our process evolution can be seen in figure 4.
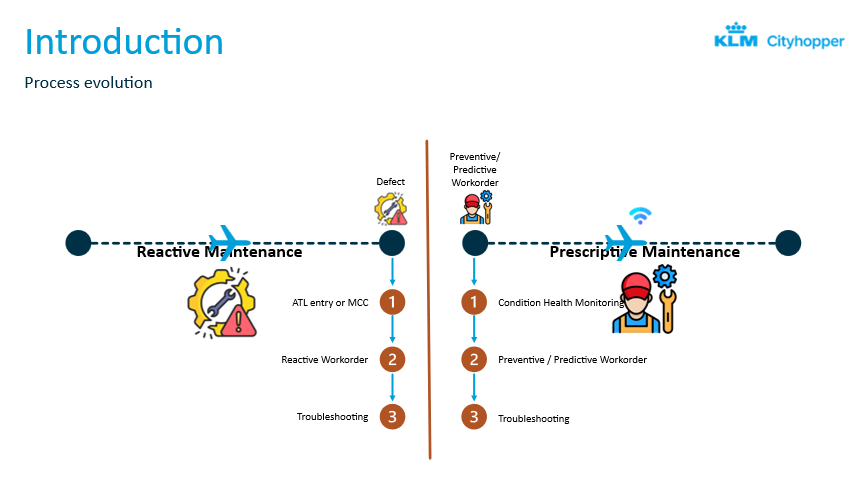
Figure 4
We started with traditional reactive maintenance. If the aircraft was flying and a defect came up, you needed to start troubleshooting, make an ATL (Aircraft Technical Log) entry and contact the maintenance control center MCC. With predictive maintenance, we continuously monitor the health of the aircraft every day and determine when we need to plan the aircraft in for maintenance. Based on that, we also request certain actions for our MRO to execute; such as a pump replacement or servicing the system, etc. There is less troubleshooting involved, but sometimes we issue, say, a leak check because we know there is something leaking in the aircraft, and then they need to start troubleshooting.
We have a number of goals as you can see in figure 5.
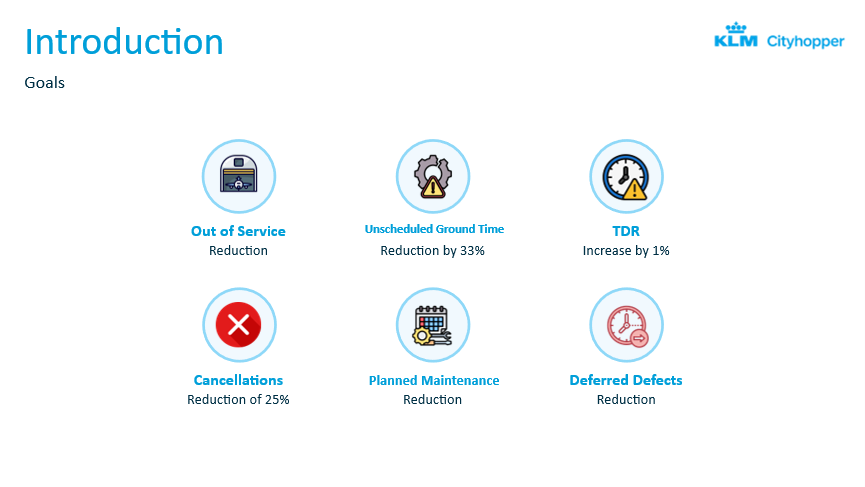
Figure 5
Our most important goals are reducing out of service and reducing unscheduled ground times, and, of course, we want to prevent cancelations on an outstation. Because regulators are involved in aircraft maintenance, it’s good to have a schematic to work to as in figure 6.
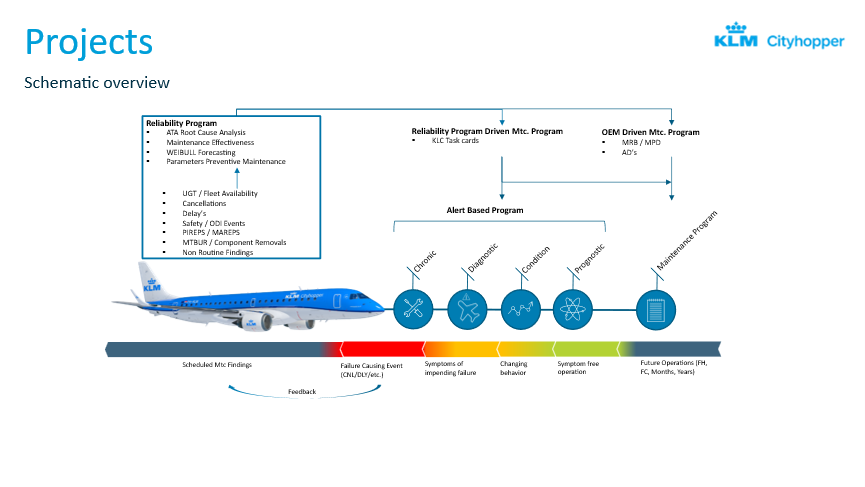
Figure 6
It starts with OEM-driven maintenance, and, with future operations, you can calculate when an intermediate check or a base maintenance check becomes due. Then there are failure causing events – AOGs, etc. That’s for the feedback loop for the reliability program to at least cope with including unscheduled maintenance into planned maintenance. With preventive and predictive maintenance, we try to build a project within the regulatory limits and an alert-based program. First, Chronic aircraft defects, where there is a repeat defect tracked on an aircraft; you tried unsuccessfully to fix it, so the complaint came back. We also have diagnostic projects ongoing based on the fault codes, and at least then you have a time span of roughly two weeks prior to the failure of the aircraft. So at least we can do something, but it’s not the biggest impact that we can achieve. That comes with condition health monitoring and prognostic health monitoring.
CHRONIC AIRCRAFT
We’ll start by looking at the old-fashioned process. For European airlines, it’s a regulatory requirement based on Part M, and we subcontracted that, as a CAMO organization, to Regional Jet Center, our MRO. It was based on AMOS data, from our M&E system, and the repeat defect tracking was based on ATA and sub-ATA. For that we needed accurate ATA coding, we needed to check it and correct it if it was wrong; otherwise, the system will not catch all the repeat defects. We also used an external IT system, but the manufacturer of the software stopped, so we had to find another solution.
For accuracy, only detected chronic defects will be solved. With less historical insights, you won’t know exactly how many repeat defects there are still on the fleet because it’s not visualizing all the repeat defects.
From the speed perspective, in 2018, we were phasing in E175s, and we were looking at the E2 which was why we considered increasing pilot and maintenance report data. And with that amount of data, it was hardly possible to do repeat defect tracking on all the ATA chapters. For example, in ATA 25, we stopped repeat defect tracking, but that’s the important ATA for your passengers and for your cabin safety. So there, there was contradiction in what we could do versus how many man hours we have. In total, it took us several hours to analyze all the data, and on the timing perspective, it was somewhat ad hoc, depending on the fleet states as well, because repeat defect tracking was done in the operational environment, so it depended on the fleet status.
Then we looked for other opportunities, so we did a tool evaluation (figure 7), market research on available tools.
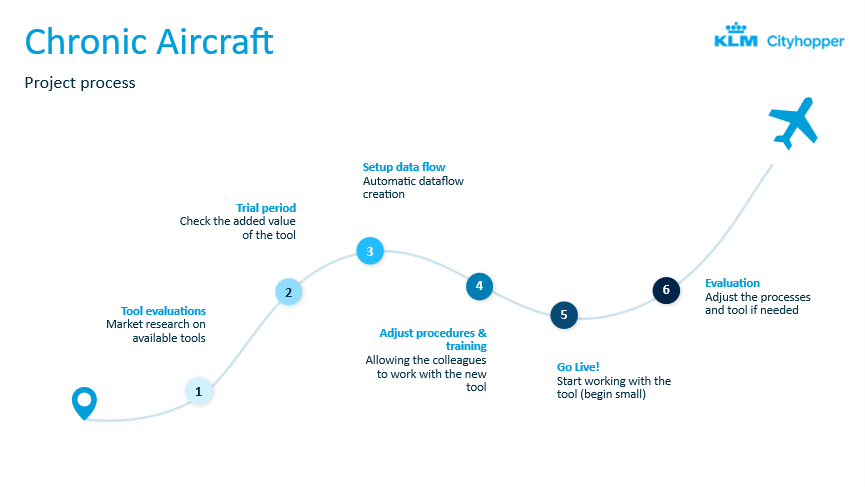
Figure 7
We selected Veryon Diagnostics for a trial period, at least to try and to see the added value of the tool in our organization. In the end, we were quite enthusiastic about it, which is why we selected it. We set up the automatic data flow coming from AMOS; all the data was exported from AMOS every three hours through the tool, and for us now that’s enough. We also needed to adjust all the procedures and give people training so that they can work with the tool. We went live in mid-2018. Afterwards we did an evaluation to change or adjust the processes where needed.
The new process automatically identifies more chronic defect candidates based on text mining, going through all the pilot and maintenance reports and identifying alerts with mixed ATAs. It also identifies alerts with aircraft synonyms such as NLG for nose landing gear. One of the biggest advantages for us is that the system provides an overview of all the repeat defects that it thinks are on an aircraft, then we need to determine whether they are real defects. But there is more visibility of what’s happening on an aircraft.
We have seen a huge reduction in process times. With the automatic identification, we can now do predictive maintenance or repeat defect tracking on our fleet within several minutes, and we can currently do that every three hours. It’s as near real time as possible and although the system would allow us to bring that reporting time to one hour, for us three hours is okay.
Figure 8 shows the overview shown when you start the tool.
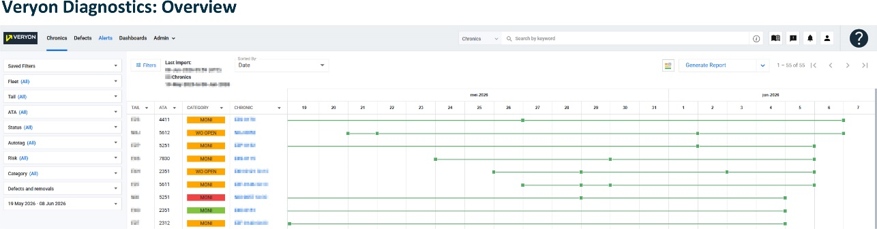
Figure 8
On the left side you have a lot of filtering settings and we decided to create some additional categories so that we can clearly identify whether a repeat defect is on monitor, or there’s a work order open to execute, or whether it’s escalated to one of our engineering groups. The color denotes level of urgency; red is an AOG situation. If the complaint comes up yellow or orange, there is a MEL (Minimum Equipment List) possibility; green is an issue of passenger convenience. We use coloring to give us some prioritization for what we need to work on.
In figure 9 you can see three repeat defects happening in the fleet, and the third or the fourth entry is determined by the solution.
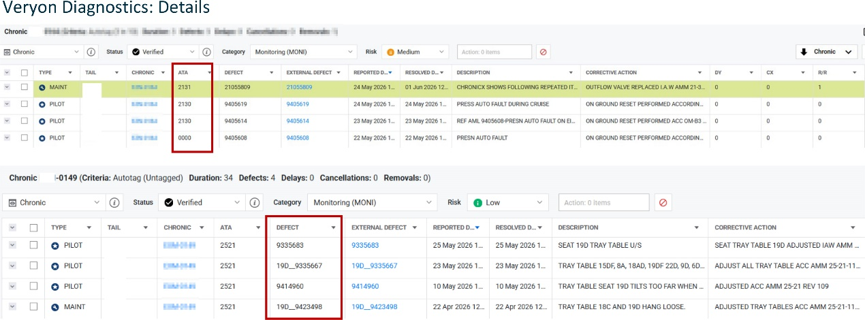
Figure 9
We create a work order in our system if we see a repeat defect in Veryon Diagnostics[SK1] [CP2] and that work order is to actually make a final fix of the complaint. Also, one of the advantages is that the tool also creates duplicate work orders in the tool itself. If we detect a certain seat row or a seat number and then you see the seat number over there in the graph as well, 90D, for example, then we can track repeat defect tracking on every individual seat. So that’s also quite a handy feature of the tool.
Collaboration
We had good support from Veryon during the initial setup. A project team was formed with members from both companies plus our MRO. Veryon’s Professional Services team of data engineers and assessors set up the data and the tools clearly, communication was fast and clear, and Veryon was open for feedback along the way. They also initiate every year a customer advisory board where they request feedback which, to us, is one of the great advantages of working with Veryon. We have regular technical and evaluation meetings with our end users and Veryon to see if we can adjust processes to better leverage the tool, or whether there might product configuration updates that could make the tool more effective for our fleet.
CONDITION HEALTH MONITORING
One of the other projects that we that we run is Condition Health Monitoring. Figure 10 is a schematic of our project team where we develop our own condition health monitoring models with our engineer predictive maintenance projects.
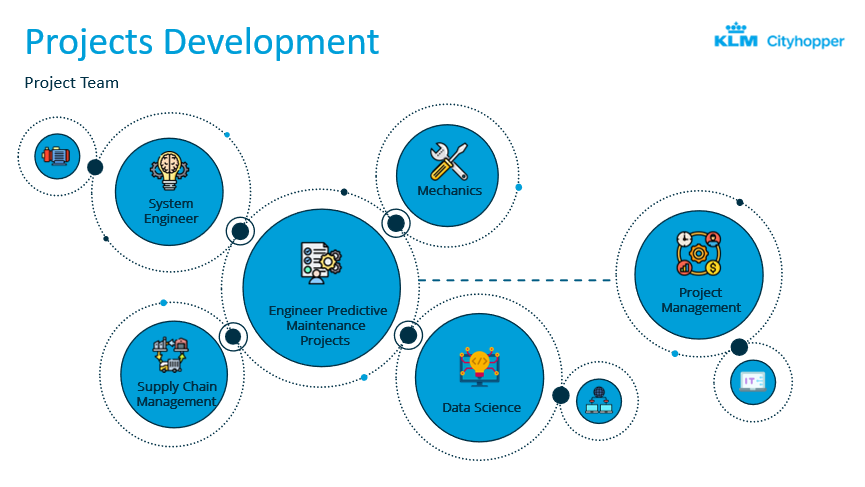
Figure 10
That is the project leader for every project, connecting departments like supply chain management, system engineering, mechanics, and data science, to identify any predictability in failures. Sometimes we need to deal with the vendors as well, and we need some additional IT support. As project management, I try to see an overview of the whole project and program within KLC, RJC, and KLM.
For criteria to start a project, we look at operational impact (figure 11).
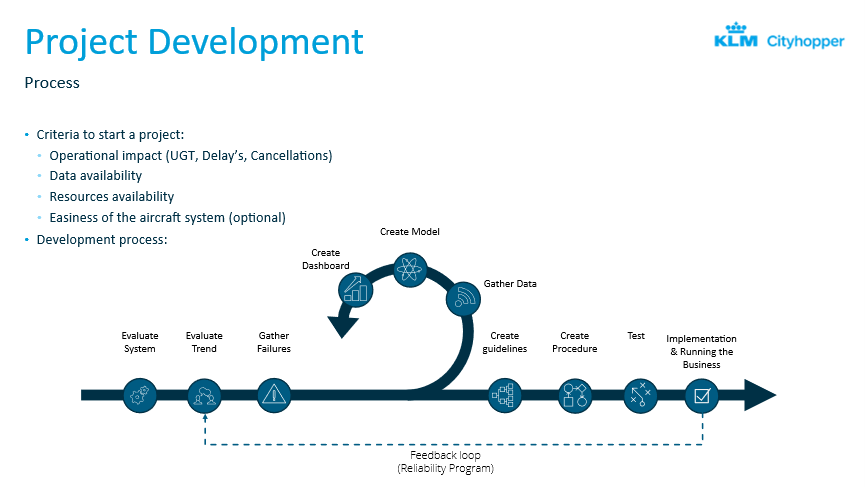
Figure 11
Of course, with predictive maintenance, we want to reduce unscheduled ground time delays and cancelations, so that’s the biggest criteria to start a project, but we also need data. So, we also look at data availability and resource availability; we are quite a small organization, so sometimes the workload is quite high on certain system engineering groups; therefore, we can spread between groups. We also consider easiness of the aircraft system. Sometimes it’s just nice to have an easy example for predictive maintenance to sell it internally to cabin operations, flight ops, etc. Normally we focus mainly on the operational impact.
From the process, we start to evaluate the system; we try to gather all the information that we can from the system, all the parameters coming from the aircraft, but also the system description, how it actually works, shop reports, etc. are also analysed, and we try to find a trend together with all the gathered failures because we need failures in the end as well. And then we run a loop to gather the data, create models, and create dashboards. And we run this loop until we find any predictive behavior in the pattern. If we cannot find any predictability in it, then we will put the project on hold as well because sometimes it’s not doable to put more resources in it; then we put it on hold. But at least we document why we put it on hold so that maybe we can start it later on as well.
If we find any predictability, then we will create guidelines, create procedures, and we will test it in our operation. If it’s successful, we implement it to run via the reliability program. That forms the feedback loop to show how effective the model is. If we need to adjust the model, etc. Sometimes a service bulletin is coming up and then the predictive model is not needed anymore, in which case we stop it.
A little bit about the maintenance overview for 2025 can be seen in figure 12.
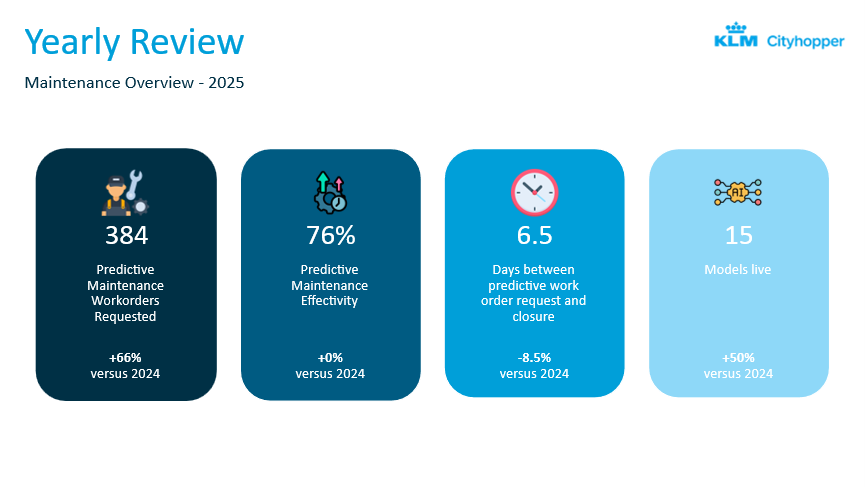
Figure 12
For 2025, we initiated roughly 380 predictive maintenance work orders that we requested our MRO to execute to prevent upcoming failures. 76 percent were effective, and that includes where we found a defect during the shop report analysis, or in the shop, or we fixed the complaint on the aircraft. Sometimes we can see that we fixed the complaint on the aircraft, although the aircraft was still flying, or we could not find anything, but 76 percent effectivity is okay for us. The average days between initiating the work and when the work is executed is roughly six and a half days. That’s okay but means that we need to predict an upcoming failure 10 days in advance. Then we request a work order to our MRO and be sure that they are able to plan the aircraft maintenance we need ten days before they actually execute the work order. Currently we have 15 models live. If that seems a lot, back in 2017, we hardly had any database within KLC or KLM. So, the first couple of years, we did a lot of data gathering, data processing, etc. and now we have everything in place, we can actually speed up the development time of all the models. That’s the reason why we also have a 50 percent increase compared to 2024.
A PRACTICAL CASE
To put all of this into a real-world context, figure 13.1 is about a practical case based on hydraulic leakages.
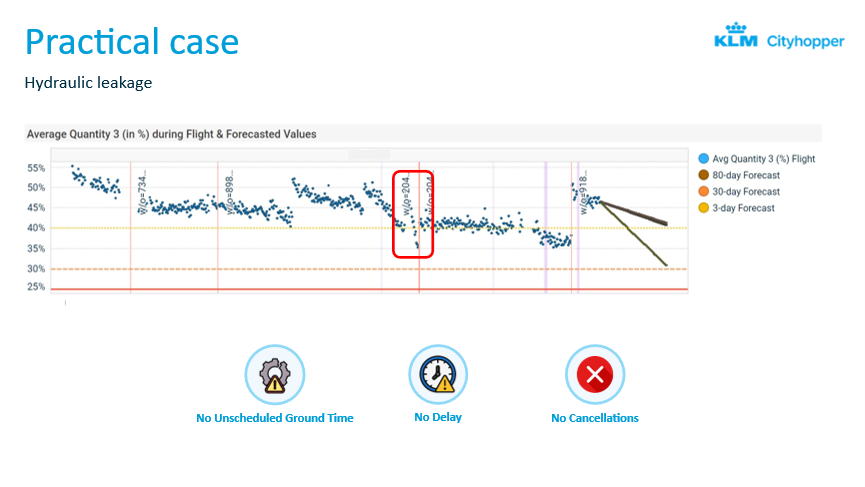
Figure 13.1
The figure plots the pattern of the quantity on our or one of our aircraft. Hydraulics is system number three. We have three forecasting lines, and we can pick one of the lines when we see degradation in the system. Sometimes 90 days is accurate; sometimes we need 30 days and, if there is a real leakage, the three-day forecast is really accurate. So, we need to determine which one we select. In the red square, there was a leakage detected by our system, and this was just in a trial phase within predictive maintenance. We removed the component with no unscheduled ground time, no delay and no cancelation. The pump was sent to the shop to see what was happening in the pump because we had seen this pattern quite a lot. We replaced the component quite often, but on an AOG basis. The shop removed every part, every piece and part of the of the pump, put it on one big table, and did some analysis on why we found the leakage so often (figure 13.2)
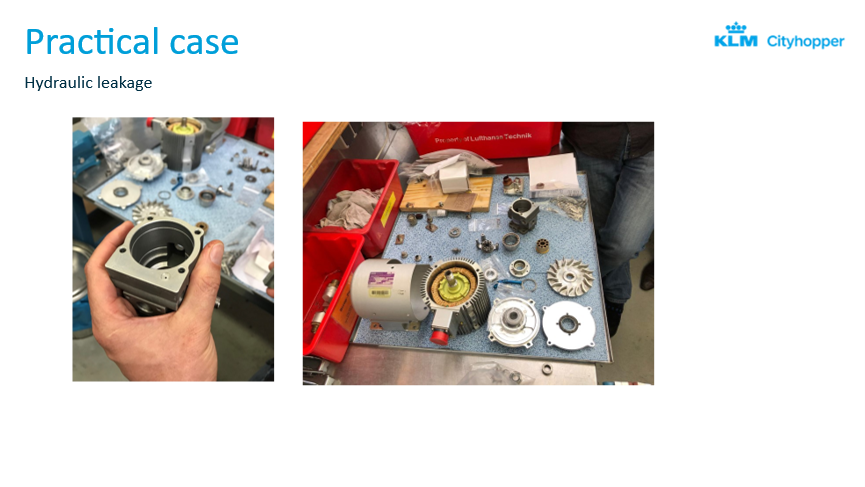
Figure 13.2
Also, we went with the whole team to the shop to actually see what was happening with the pump and to make everybody enthusiastic about predictive maintenance. When the pump was further investigated (figure 13.3), at the right-hand top metal debris was found coming off the teeth of one of the components, and metal debris caused damages on the on the seal inside, which caused the leak, and that you see on the below on the right.
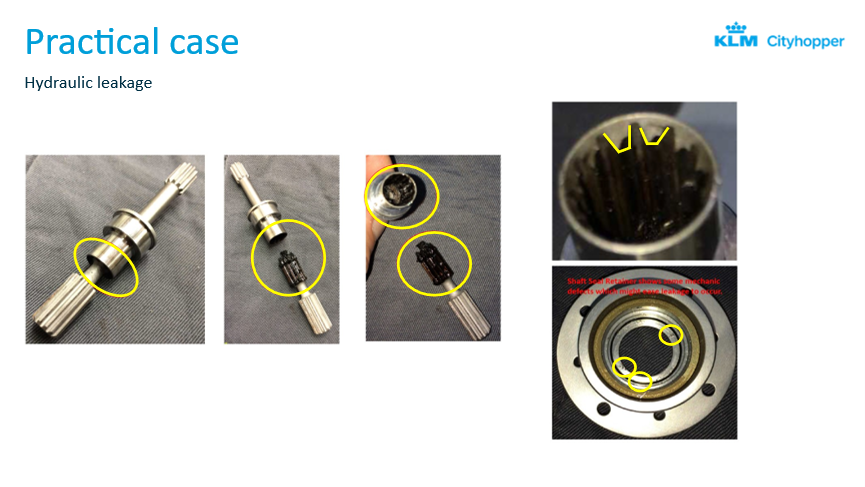
Figure 13.3
We shared this information with the pump manufacturer and explained that we had seen this quite often. The manufacturer of the pump was working on an improved version at the time of writing, to prevent these failures, and that summarizes this case study, because, in the end, predictive maintenance is just a mitigating action. In the end, you want to improve the reliability of your fleet, or components, or the aircraft itself, and with predictive maintenance, at least you can get more insights on what’s happening on the aircraft. You can reduce the operational impact, but in the end, you are still replacing components more often than they are designed to. So that’s the reason why we use this data as well in our discussions with the vendors and try to improve component reliability.
Ends…
Contributor’s Details
Robin Duteweerd

Robin Duteweerd is Fleet Manager at KLM Cityhopper, driving performance, innovation, and predictive maintenance for the regional carrier’s advanced Embraer fleet. Since joining the airline over eleven years ago, he has held vital engineering positions, including Reliability Engineer and Project Manager for preventive maintenance. Backed by a Bachelor’s degree in Aviation Studies from Amsterdam, Robin plays a pivotal daily role in ensuring short-haul fleet reliability and operational excellence.
KLM Cityhopper KLM Cityhopper is the regional airline subsidiary of KLM Royal Dutch Airlines, headquartered in the Netherlands. Operating directly from its main hub at Amsterdam Airport Schiphol, the carrier provides vital short-haul feeder services to over 70 business and leisure destinations across Europe. As a core part of the Air
Comments (0)
There are currently no comments about this article.
To post a comment, please login or subscribe.