Articles
| Name | Author | |
|---|---|---|
| CASE STUDY: JetBlue Airways is on a fuel-saving journey using data analytics and pilot apps | Chris Lum, Director and System Chief Pilot, JetBlue Airways | View article |
| CASE STUDY: Amelia takes flight to reduce contrails | Adrien Chabot – Chief Sustainability Officer, Amelia | View article |
| CASE STUDY: From paper to digital charts at KLM | Emiel Snippert, EFB Project Manager / First Officer, KLM | View article |
| CASE STUDY: Breeze moves to AI-enhanced weather intelligence | Garrett Urry, Manager of Flight Dispatch, Breeze Airways | View article |
| CASE STUDY: Data-Led Fuel Efficiency | Luke Towler, Fuel Efficiency Systems Manager, Jet2.com | View article |
| CASE STUDY: Delta’s journey to a unified Content Management System | Jennifer West, Manager of Flight Ops Publications, Delta Air Lines | View article |
CASE STUDY: From paper to digital charts at KLM
Author: Emiel Snippert, EFB Project Manager / First Officer, KLM
Subscribe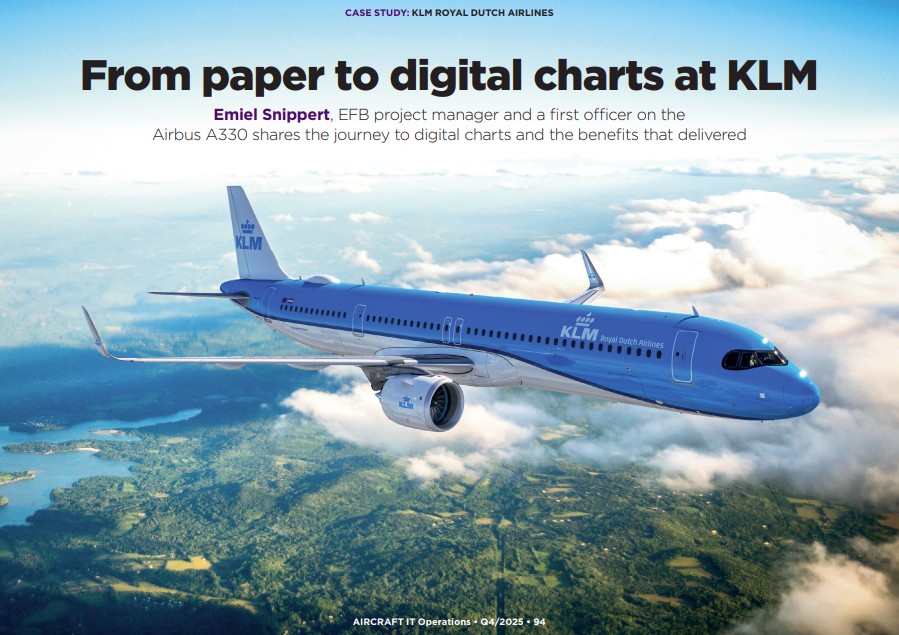
Emiel Snippert, EFB project manager and a first officer on the Airbus A330 shares the journey to digital charts and the benefits that delivered
Having been flying with KLM for fifteen years, I can remember, as second officer, having to carry on board, at least for long haul flights, two large bags of charts and documents. In this article, I’ll take you through the journey that we’ve made over the last ten to 15 years, progressing from paper to digital charts. But before that, a brief introduction to KLM.
KLM ROYAL DUTCH AIRLINES
Founded in 1919, KLM is the world’s oldest airline still operating under their original name. The fleet includes about 180 aircraft, of which 66 are long haul aircraft, and the airline serves 156 destinations directly but 691 destinations with partner airlines.
FROM PAPER TO DIGITAL
For about 90 years, KLM had maintained our own charting company, drawing our own charts within the airline but, in 2010 we stopped making our own charts. That change is still, for some people, a big loss, because their passion is making charts. But for KLM, we have been paperless for OFPs (Operational Flight Plans) and charts, for about 12 years. That was a big step 12 years ago but now it’s just normal business.
Once upon a time at KLM, a cockpit would look like the picture in figure 1.
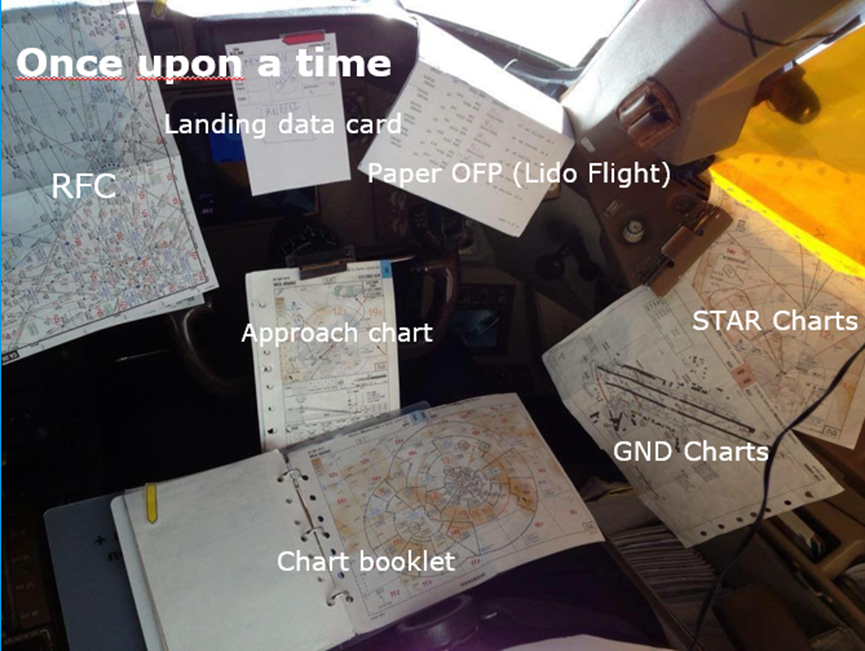
Figure 1
This might be a slight exaggeration, but these are all charts that pilots would normally use at KLM. You can see charts, an OFP and a landing data card, which was removed in the last four years. Most pilots think that the change is good, but that no change would have been better; it takes some time to get used to. In 2007, we started off with Lido Navigation from Lufthansa Systems, and they developed, in the beginning, three applications, which was manuals, the enroute charts which are the RFCs, and the terminal charts – all still paper-based. You can see the Nav Bags in figure 2,
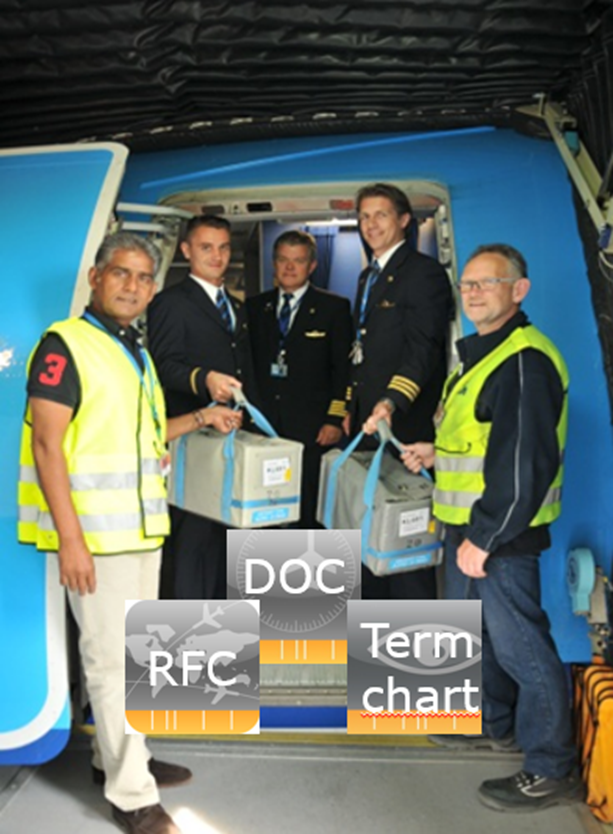
Figure 2
This was the first flight which was done without the Nav Bags and then we went from the large Nav Bags to what you can see in figure 3, that was a big leap for us. The Nav Bags were offloaded.
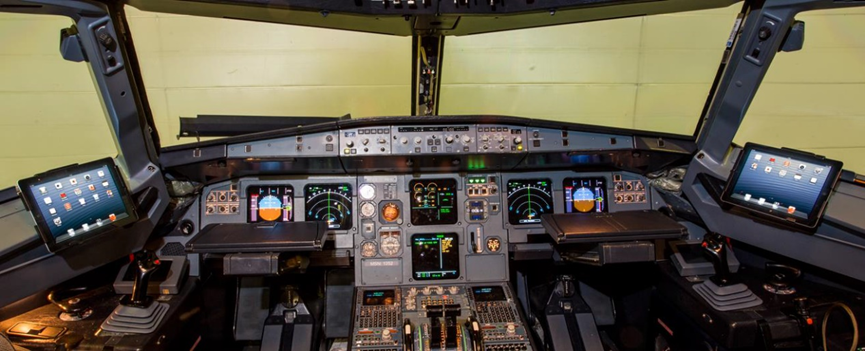
Figure 3
After some time, Lufthansa Systems created a digital app including all Lido charts. So, we went from a lot of paper (figure 1) to what you see in figure 3, which is a dream come true. With this transformation, pilots were able to have more situational awareness, because all the information is now available in one place. And it’s not only about the way pilots work, but also about the environment: We made a calculation that two Nav Bags were about 45 kilos, so over the last 12 years, since we went paperless, it has saved us millions of kilograms of fuel, and therefore CO2.
CONTINUOUS DEVELOPMENT
It started with just the regular chart that you can see in figure 4.
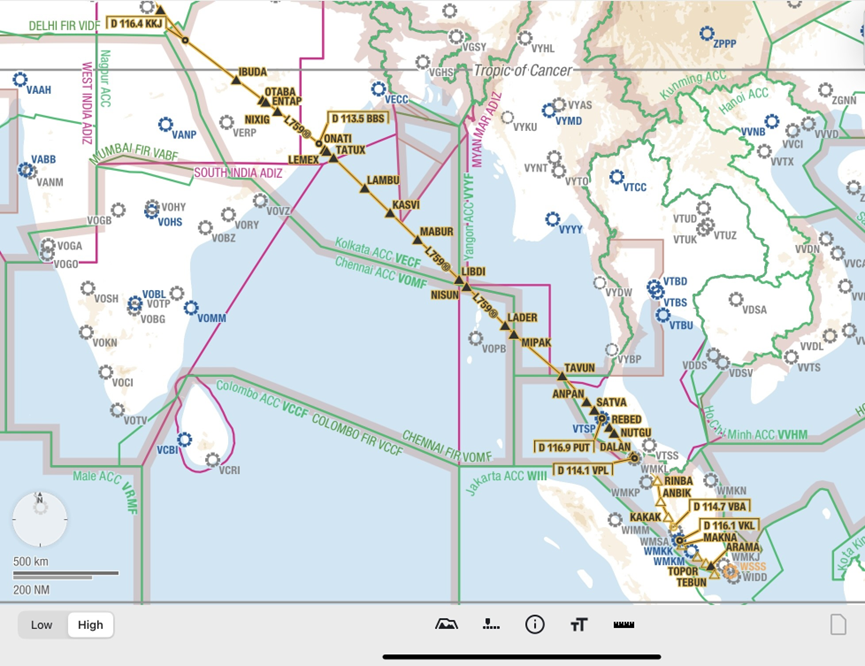
Figure 4
At the time, it was an exciting development for KLM pilots but now it’s just the simplest of maps.
We were also struggling with getting the most recent information into the cockpits. It was not such a problem with a short-haul flight. That’s normally two to three hours maximum so that, if you have TAFs (Terminal Aerodrome Forecasts), and a lot of predictions at the start of the flight, those will still be valid throughout the duration of the flight. But we also do a lot of long-haul flights, which are sometimes 12 to 13 hours duration. For those, it would be good to have updated information during the flight. And then in the last five or six years, we have introduced Wi-Fi connections on the aircraft, and that meant that we could extend the vision that we had for the charts we had on board. In the beginning, we had weather information from a dispatch organization which is following the weather for you; but now you can get that information directly into the cockpit, included in the charting app.
TESTING WEATHER LAYERS
Pilots will know that, when you fly from north to south, south to north through Africa, you have big showers and big weather fronts there. So, with real-time information on the charts, you could make a strategic decision about how to proceed. We started testing this – figure 5, something that a lot of questions from our pilots focused on.
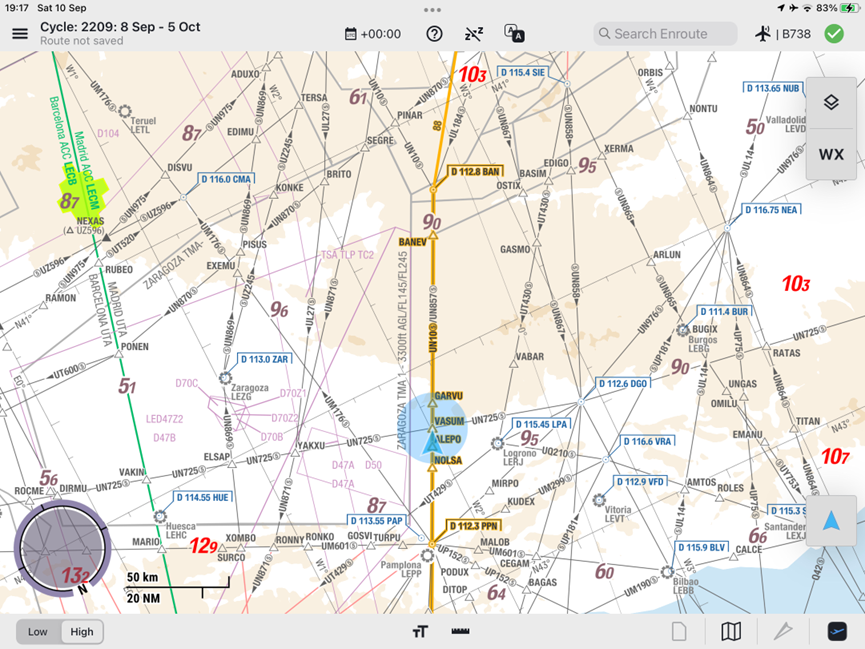
Figure 5
This is one of the first versions that we tested at KLM. At that time, I was flying short-haul, and I took this photograph through the cockpit window. On the left-hand side, you see the cloud and, on the map, I could see the light green on the top left; it was actually there. For me, that was a revelation, not that it worked but that what I could see out of the cockpit window, I could also see in real time on the map. This was my first picture, and I sent it to the video development team. Of course, they were very happy that it actually worked. This is the initial layer that we had; it shows the convection and, although this was the first version, this is the way that it looks today.
Figure 5
PILOT INPUT
There were a lot of questions from pilots such as: ‘we would like to see where the weather is going.’ If you have your cell phone and you look at a weather app, you can always push a play button and see where the weather is going. That’s
Figure 5
We put the request to the Lido team and also tried to build something ourselves together with Lido. Then we made a time-slider and a time sign so that users can see where the weather is going.
The next question was, ‘I would like to have a vertical view of the weather so that I can see whether to go over it or under it.’ Because they needed an app for that; we built a vertical profile together with Lido as in figure 6.
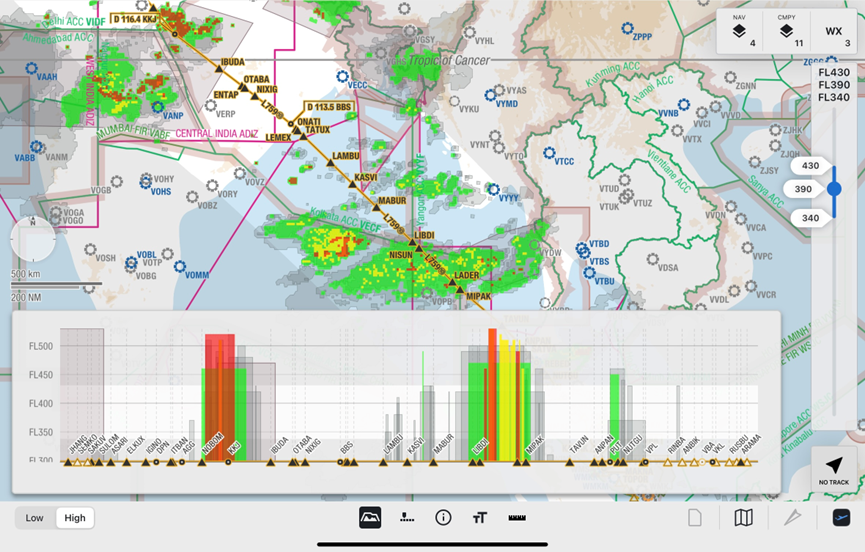
Figure 6
Figure 6 shows the development of a product starting off simple, I believe it is better to start simple and then build based on what was coming from pilots to give them what they need.
Then the next request came in, to the effect that, ‘We would like to have company layers’, as in figure 7.
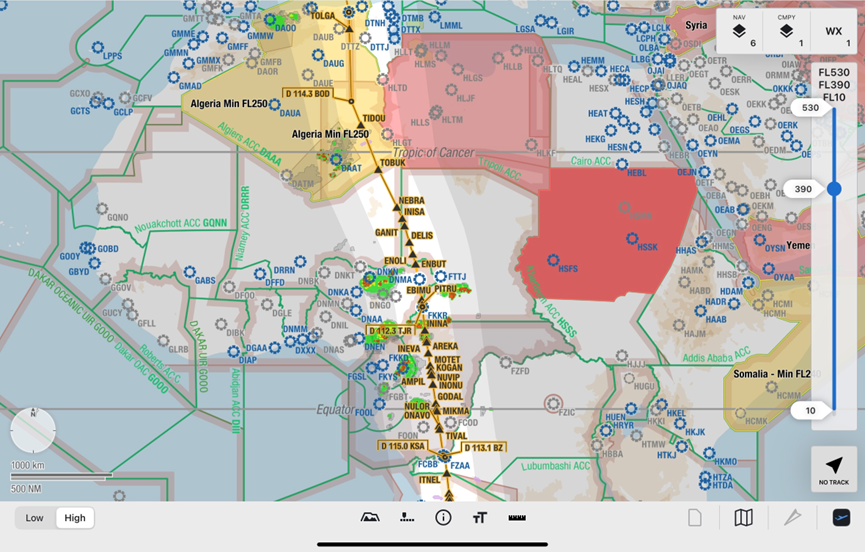
Figure 7
Layers are useful because, in the present political world, we see that there are airspaces which are not friendly to fly into. We used to have them by company, NOTAMs (Notices to Airmen), which are just coordinates, and then you would manually have to plot those in the FMS (Flight Management System) or anywhere else to see where you are able to fly or not to fly. So, then we built, together again with Lufthansa Systems, Company Layers, and that can be any polygon you want.
It was just prior to and during Covid, 2020-21 when we started developing layers. In the figure, you can see, well, how would you like to define map features? At KLM, because we have been doing this for 105 years, we do that by point, by river, by political border, by straight line, by anything you can think of. We used to define a polygon, and that makes it very difficult to build. What we found during development was that there were a lot of things coming up which we hadn’t thought of when we started developing. And so, the Lido experts came to us, and we had a discussion with the pilots. We tried every flight and explained to the pilots what we wanted to do. We have a special, dedicated team of pilots who just fly the aircraft and don’t have an office job. They give us valuable feedback, and that feedback is then passed on to the Lido team.
Just recently, we got the approval for using the AMM (Airport Moving Map), which is like Google Maps so that, at the airport, pilots can just navigate towards their clearance limit, and that helps us a lot in situational awareness.
WORKING COLLABORATIVELY
We have a very strong connection between the developers at Lufthansa Systems and the pilots. If there is any need from the developers to have a discussion or a dialog with our pilots, it is possible to get in contact with them. We also held a session in our reporting center, for instance, with pilots who are regularly going out on flights to ask them if they had time to have a little bit of a dialog with Lufthansa Systems about, for instance, how do you use the maps? It was one day full of interviews with actual pilots.
We interviewed a lot of crew members and, as readers might know, if you have ten pilots, you will have 12 opinions. Every pilot has his or her own way of working. If you boil that down, for instance, we asked, ‘what would you like with the weather layers?’ The answer was, ‘I would like to know where the weather is going.’ So, we asked a lot of pilots, what would you like? Would you like the vertical profile first, or would you like the movement of the layers first? Most pilots said they would like the movement of the layer of weather first, so we built that. In my opinion, I see that the weather layers and the development of the charts helps me to make better strategic decisions much earlier. For instance, if you fly through Africa, you have those big weather systems. I can deviate sooner. I don’t have to wait, and I don’t fly into a cul-de-sac. The aircraft’s weather radar is unable to see behind the weather system; so, if you think you are going to the right, say, and deviating from the weather, you could be entering a cul-de-sac, which is behind that weather system. Now, with the connectivity we have the weather oversight, I can make the decision much sooner, save the fuel and have a safer flight. I have used that many times now flying towards Africa.
And then here’s the sentence, “Pilots are good at telling what they want, but they’re not so good at telling what they need.” So, we carefully examine the feedback of what pilots say they want and deliberate about what it is that they actually need. Do they really need the movement of the layer? Do they really need the profile, or is it something else that they want?
BENEFITS OF USING LIDO AND PROGRESS TO DATE
From the perspective of a pilot using the software from Lido, the first benefit is that it’s user friendly. There is a single app for all the charts and there is a much higher level of situational awareness, on the ground and in flight. Especially thanks to the weather features we’re using which include convection, cloud tops, forecasted and reported turbulence, icing, segment, tropical cyclone and volcanic ash. It also supports better decisions because there’s a lot of feedback, which we then relay back to Lufthansa Systems.
One of the newest layers, which we have pushed for, and which has been introduced at KLM, is the GPS jamming and GPS spoofing layer, or GPS Interference Detection as it’s named by Lufthansa Systems. This is also an example of building the software together. When GPS jamming and spoofing was becoming an issue for a lot of aircraft, especially on our Boeing fleet, we wanted to proactively be able to tell the pilots, “You are entering an area of GPS jamming now, please follow the procedures to avoid system interference of any GPS signals which are infected.” That’s just another layer; Lido is always trying to develop the product into the next level. Figure 8 is a picture of how it looks now.
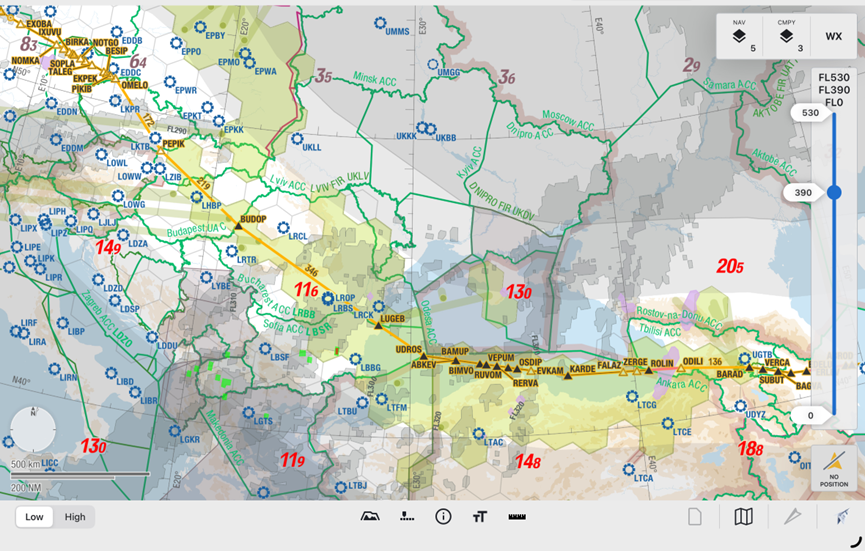
Figure 8
This is a flight from Amsterdam to Singapore and here you also see a lot of colors and a lot of information. But pilots are professionals and are used to looking at a screen with a lot of information on it. They know where to look for the information that they want. If I want more information about something, I can drill down. I can switch layers on or off. There’s a flight level selector and you can see how busy you can be during a flight because the light purple is turbulence and the green is GPS jamming/spoofing, you have weather, you have everything going on around the aircraft. If you were still flying with paper charts, there would not be the insights you have here, leaving out all the security areas which are more to the east. So, as a pilot, you can see how your situational awareness is much higher.
Working with Lufthansa Systems and the Lido team is a great experience. They’re doing similar things with other companies, I know if you can build it for KLM, you can build it for anybody. A lot of our requirements are so broad, and we do everything, so we are a very good test case. We have seen it with, for instance, Jeppesen, we’ve seen it with Lufthansa Systems, we’ve seen it with AVIOBOOK: a lot of software development we do in close contact with our software developers.
Embarking on any large-scale change is always a challenge and especially for a complex business like an airline so I hope that this case study will be useful for any colleagues considering a similar development for their airline.
Comments (0)
There are currently no comments about this article.
To post a comment, please login or subscribe.