Articles
| Name | Author | |
|---|---|---|
| CASE STUDY: From startup to multi-station airline: BeOnd digitizes and scales up flight operations | Zain Eejaz, Manager, Flight Operations Technical & Planning, BeOnd | View article |
| CASE STUDY: Saving fuel in the climb at KLM Cityhopper | Torsten van Kouwen, Business consultant ATM and & Matthies Dubelaar, Business Pilot Digitizing; both at KLM Cityhopper, Flight Operations | View article |
| CASE STUDY: Wizz Air achieves greater fuel efficiency, during descent | Captain Petros Souppouris, Safety Captain and Fuel Efficiency Promoter, Wizz Air, and David Bronks, Key Account Manager, AVTECH | View article |
| CASE STUDY: Peach Aviation optimizes airport and obstacle data management | Yuya Maeda, Performance Engineer, Peach Aviation | View article |
| CASE STUDY: Marabu Airlines improves EFB-to-Operations and Crew Management data handling | Maxim Dubovik, EFB Administrator & Manager, Marabu Airlines | View article |
| CASE STUDY: The perfect balance with documents at Sunclass Airlines | Anders Hofmeister, Captain and Manual Administrator, Sunclass Airlines | View article |
| CASE STUDY: A rapid digital evolution at Discover Airlines | Alexandra Kosjuberda, Manager Crew Training, Discover Airlines | Sarah Kurowsky, Manager Flight Ops Engineering Support, Discover Airlines | Arne-Martin Gruene, Project Manager, Lufthansa Industry Solutions | View article |
CASE STUDY: Peach Aviation optimizes airport and obstacle data management
Author: Yuya Maeda, Performance Engineer, Peach Aviation
Subscribe
Yuya Maeda, a Performance Engineer at Peach Aviation, explains how a semi-automated NOTAM assessment tool developed with NABLA Mobility addresses the challenges of obstacle evaluation by optimizing data for takeoff and landing calculations.
Words: Yuya Maeda, Performance Engineer, Peach Aviation
This article is primarily about having better and more detailed obstacle avoidance information. But in order to give readers some context, I’ll start by introducing Peach Aviation, explaining the process of NOTAM (Notice to Airmen) evaluation and the challenges we had before implementing the new system. Then, I’ll look at the new system, its function and the benefits we gained. Finally, I’ll explain how we continue to improve the system.
I’d also like to offer special thanks to my colleagues, Flight Operations Engineers Azusa Kuboi and Kotaro Tanabe, and Flight Operations Systems SME Kosuke Munakata, for their involvement in the development of OBST and the preparation of this case study.
PEACH AVIATION
Founded in 2011 and based in Osaka, Japan, Peach Aviation is a group airline in the ANA (All Nippon Airways) Group, operating 40 routes, mainly in Asia, from Osaka and Narita in Tokyo. We also fly to China, Korea and Singapore. Our fleet of 35 aircraft includes the Airbus A320ceo, A320neo and A321LR.
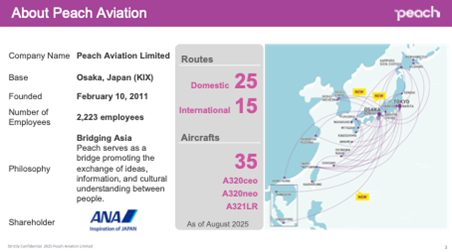
Figure 1
DATA MANAGEMENT FOR OBSTACLE NOTAMS
Peach Aviation relies on data management to monitor obstacle NOTAMs; the OCC (Operations Control Center) and Flight Operations engineers are responsible for monitoring obstacle NOTAMs. That process used to be done manually, so it took a lot of time. When there is an obstacle, such as trees, buildings or construction cranes, in the takeoff area, we have to reflect it on the takeoff performance calculation. The flight area shown in figure 2 identifies a takeoff flight path area, located after the end of the runway. Prior to takeoff, the pilots and dispatcher calculate the takeoff weight and speed to ensure that the aircraft can clear all the obstacles and take-off safely.
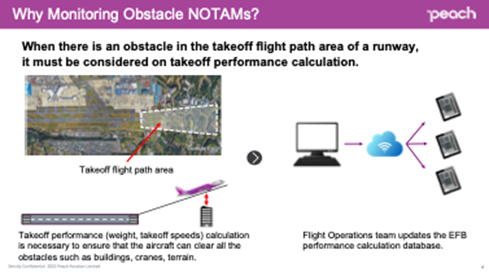
Figure 2
Monitoring and evaluating obstacles
There are several ways to manage obstacle data. At Peach Aviation, as mentioned above, teams from OCC and our Flight Operations engineers are responsible for monitoring obstacle NOTAMs. The OCC receives all the NOTAMs and checks the position of obstacles by plotting them on a map. They check if the obstacle is within the takeoff area and, if it is, they notify the Flight Operations team.
Our Flight Operations team monitors and evaluates the obstacle notes from airports, so we can confirm whether the obstacle could have an impact on takeoff performance. We verify the position and the height of the obstacle and, if it has an impact on takeoff performance, we update the airport database used for take-off calculations. (The application is called FlySmart and it is provided by Airbus).
Time-consuming effort
The challenge we had with the process is that the obstacle NOTAM assessment is a time-consuming process — inputting obstacles on a map, evaluating them and updating the database was done manually. This process was a large workload for OCC and the Flight Operations engineers.
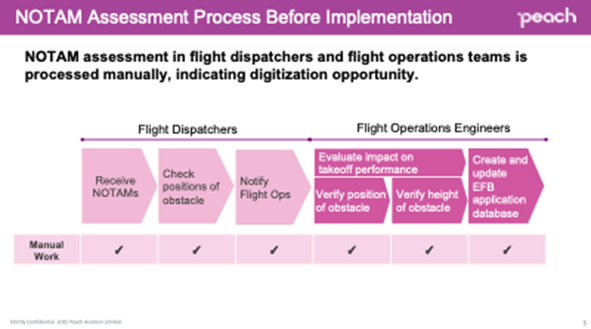
Figure 3
Because NOTAMs are published daily at all airports, the OCC had to check for NOTAMs every day. It took one to two hours to evaluate, complete the evaluation accurately and update the EFB database. As our operation grew, our routes and fleet expanded, so we had to check more NOTAMs, which further increased our workload, as you can see in figure 4.
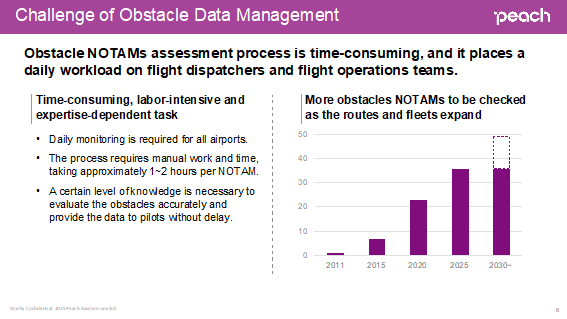
Figure 4
EVALUATING OBSTACLES
To evaluate an obstacle, we used Google Earth to measure distances from the runway, as shown in figure 5, by overlaying a takeoff flight path. This was done by noting the coordinate position of the obstacle noted in the NOTAM and plotting it on Google Earth, then using a spreadsheet to manage the database.
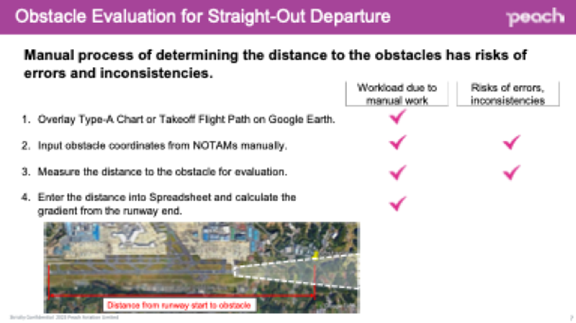
Figure 5
Once the measured distance had been entered into the spreadsheet, we could check whether or not it had an impact. However, there was a risk of errors and measured distances might vary depending on the engineer who calculated them as we had to measure the distance by hand using Google Earth.
Turning after takeoff
The turning departure is much more complicated. In some airports, pilots are instructed to turn immediately right or left after takeoff. Figure 6 shows Haneda Airport in Tokyo, where we have to take a right turn after takeoff (the red line on the map).
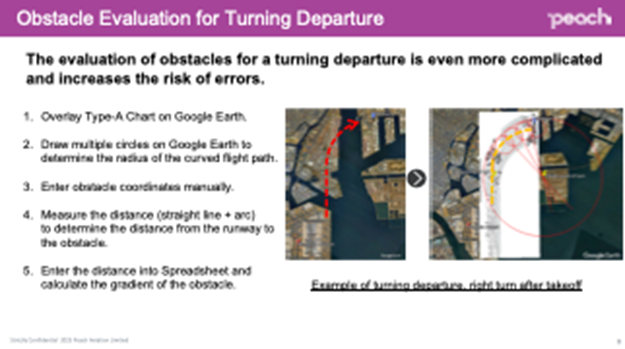
Figure 6
To do this, we overlaid a Type-A chart (shown in white in the diagram on Google Earth). We had to calculate the straight-line part and the curved flight path. For a curved flight path, we made drawings to get the radius and angles. These tasks took time to complete, and our team wanted to avoid having to do them. To remedy this, we decided to implement a system to automate part of the process. The results are time savings and reduced workload.
SOLVING THE PROBLEM
To solve the problem, we decided to implement a system that automates the data management process. Our Flight Operations engineers and OCC discussed what needed to be done and the necessary functions. Firstly, simple NOTAM input is a necessary feature, so that the solution is easy to use. Secondly, the system had to read information automatically, visualize it on a map and measure the necessary distances for takeoff and performance evaluation. Easy communication across the OCC and flight operations teams was also an important requirement.
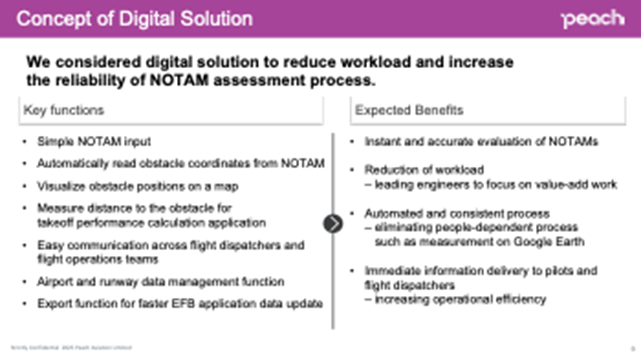
Figure 7
A single integrated system
As we manage the runway database in a spreadsheet, we wanted to integrate it into one system, so airport and obstacle data can be managed together. When obstacle data or runway data is updated, we have to reflect it in the EFB database. Also, we needed an export function, in order to be able to update the database faster.
From these functions, we expected that the process of evaluation could be done accurately and instantly. Furthermore, the workload for OCC and the Flight Operations engineers needed to be reduced, so engineers could focus on other tasks, and flight dispatchers could spend more time on flight planning. Automating the process would eliminate people-dependent tasks, enabling us to deliver the necessary information to pilots without delay and improve operational efficiency.
COLLABORATION PAYS OFF
We decided to develop this system with NABLA Mobility, a Japan-based startup company. Peach already has a long-standing collaboration with NABLA Mobility on fuel-mitigation and turbulence avoidance projects, including an EFB (Electronic Flight Bag) solution. Given that we are used to working together, Peach Aviation decided to collaborate with NABLA Mobility to develop a semi-automated obstacle data system, illustrated in figure 8, for reliable, faster and efficient processing. NABLA Mobility’s turbulence avoidance system already works on an iPad, which is convenient to use, and we knew that they offered good support and understood our needs.

Figure 8
HOW THE SOLUTION WORKS
When we receive a NOTAM, we copy and paste it into the system, which automatically redirects NOTAM information, such as airport or effective date. On the system, when you click the map tab, the obstacles are visualized automatically, and the distance is measured in a few seconds. For turning departure cases, the process was very complicated, but now we simply paste the NOTAM and the evaluation process is completed. We have reduced a lot of our workload and minimized the amount of manual work required.
Obstacle data management
We also implemented a function to evaluate the obstacle vertically. For example, on the left side of figure 9, we assume that there are four buildings in the take-off path area, and the third obstacle is lower than the second obstacle. In this case, as there is no impact on takeoff performance by the third obstacle, we don’t have to reflect the third obstacle on the EFB database and we can reduce the number of updates of the EFB database. This helps us to improve operational efficiency. The right side of figure 9 shows that when the obstacles are small and below a 1.2 percent slope, then they can be removed as well.

Figure 9
Obstacle data is usually published in AIP (Aeronautical Information Publications) and NOTAMs. In Japan, obstacles are published in KML (Keyhole Markup Language) and Excel files as shown in figure 10. We developed the system so that it can automatically detect and locate the position of the obstacle, evaluate the obstacle, and remove any that are outside the takeoff path area by uploading the KML files.
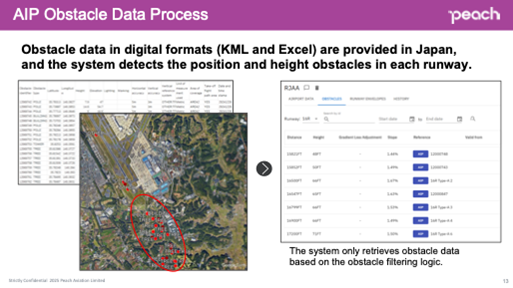
Figure 10
We can also see how many obstacles are listed. On the right side of figure 11, the red icons mean a new NOTAM has been input by OCC and has to be checked by our flight operation engineers. When the flight operation engineers complete the evaluation, we change the icon to green. Using this function, we can see the status of a process and it is easier to communicate with OCC and Flight Operations engineers.

Figure 11
Runway data management
We’ve dealt with obstacle data management. Now we’ll look at runway data management, see figure 12, which shows runway lengths, which are published in AIP. We were using a spreadsheet-managed database, but we integrated the database management system into one system, so now the runway data from AIP can be input and updated in a single system to simplify how we manage the data.
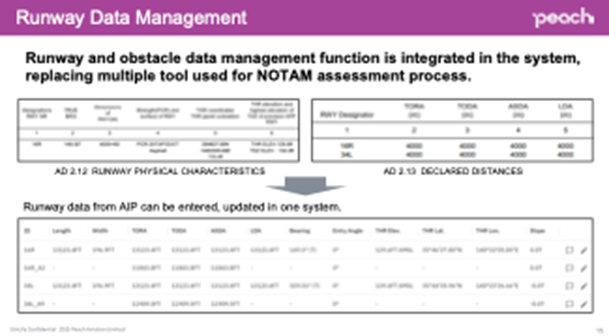
Figure 12
Usually, runway data is updated on the AIRAC (Aeronautical Information Regulation and Control) cycle every 28 days. We can select the appropriate AIRAC cycles on this new tool. For example, when the runway data is updated on the next AIRAC cycle, we can select the appropriate target AIRAC cycles and update the database. On the right side of figure 13, we have the modification history record functions. All the timelines and all the modified parameters are recorded, so we can view which parameters have been modified.
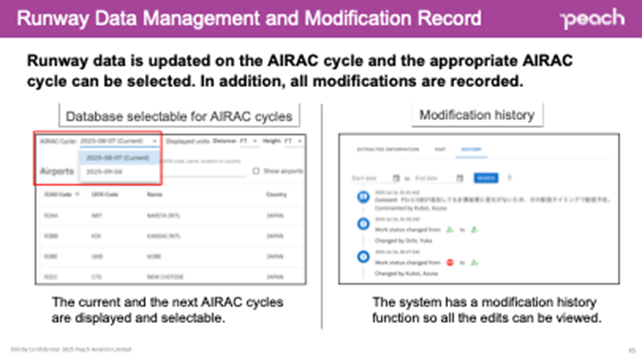
Figure 13
Taking account of obstacle shapes
Another consideration is that there are different kinds of NOTAM published. When multiple coordinates are written in one NOTAM, in some cases, the coordinates describe that there are multiple obstacles, in some cases, the coordinates are written to describe the shape of the obstacles. The system automatically identifies the shape of the obstacle and measures distances accordingly by reading the NOTAM text format.
Also, we implemented an import function of a flight path in KML format. For example, in figure 14, you can see a mountain area to the left of the airport, so we have our own flight path to avoid flying over this mountain area. We import our flight path into the system in KML format, and then the system can analyze the obstacle information based on our flight path.
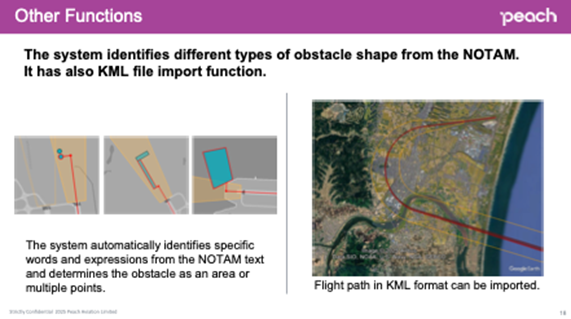
Figure 14
BENEFITS OF THE NEW SYSTEM
The flight dispatcher simply copies and pastes the NOTAM into the system, which automatically starts the evaluation, as in figure 15, reads the coordinates from the NOTAM, visualizes it on a map and measures distances. The most complicated part has been replaced as it is automated. We have eliminated people-dependent tasks to minimize input errors, including inconsistencies of measurement.
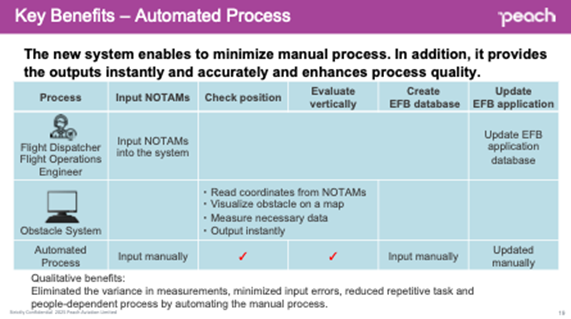
Figure 15
Time savings are significant. For flight dispatchers we save about 90 seconds per obstacle NOTAM. This number may seem small, but we have about 70 NOTAMs a month. That means we can save 105 minutes a month. The more NOTAMs you have to check, the more time you can save. For Flight Operations engineers, we save about 15 minutes per NOTAM. In addition, we save more than an hour for AIP obstacle data in Japan.
We use AIPs and NOTAMs as a data source (see figure 16), and before the implementation, we were using the spreadsheet and Google Earth as a data management tool. Now, those tools are replaced by one integrated system, so the runway data and obstacle data management has been simplified.
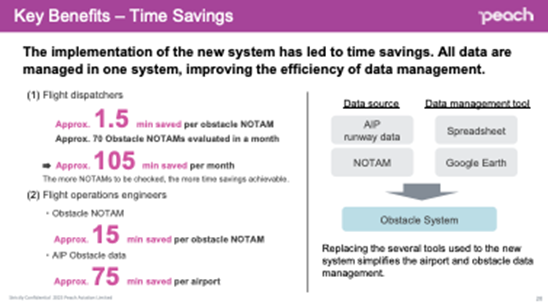
Figure 16
LOOKING TO THE FUTURE
We are continuing to improve the system, starting with expanding the readable obstacle data. In Japan and some countries in Asia, obstacles are also published in AIP supplements. This year, we are developing an automated process for AIP supplements. In many countries, the Type-A chart shown on the left of figure 17 is published in PDF format. It contains many obstacles, making it difficult to read. We plan to implement a system where we can easily read the obstacles from Type-A charts in PDFs and NOTAM formats, depending on the countries.
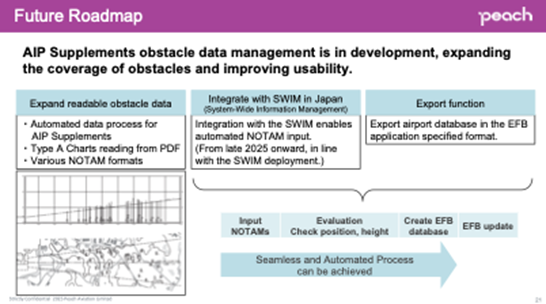
Figure 17
The second point is that we plan to integrate with the SWIM (System Wide Information Management) after its development, so when the NOTAM is published it is automatically entered in the system and the system can start the evaluation.
Thirdly, we plan to implement export functions. We have runway data and obstacle abort data in this system. When there is an obstacle or runway data update, we can update the EFB database easily. We plan to export the database in an EFB-specified format, so we can update the EFB database faster. By integrating with SWIM, and by developing export functions, we plan to automate the full process from the input of NOTAMs to updating the database.
I hope that, in sharing our experience, this case study will be useful for readers faced with similar challenges and/or contemplating a similar change program.
Comments (0)
There are currently no comments about this article.
To post a comment, please login or subscribe.