Articles
| Name | Author | |
|---|---|---|
| Case Study: Atlas Air – Paperless, that’s the plan | Andy Genao, Senior Manager, Maintenance Planning, and Michael Henry, Director Maintenance Planning, Atlas Air | View article |
| Voice Technology Innovations in MRO | Scott Powell, Senior Manager, Product Marketing, Honeywell | View article |
| The changing face of data | Sander de Bree, CEO, EXSYN | View article |
| Information: how to get what you need | Bijoy Mechery, CEO, and Brent Heath, Senior Vice President, Seabury Solutions | View article |
| Column: How I See IT – The Significance of Telepresence | Paul Saunders, Solution Manager, Flatirons Solutions | View article |
Information: how to get what you need
Author: Bijoy Mechery, CEO, and Brent Heath, Senior Vice President, Seabury Solutions
SubscribeInformation: how to get what you need
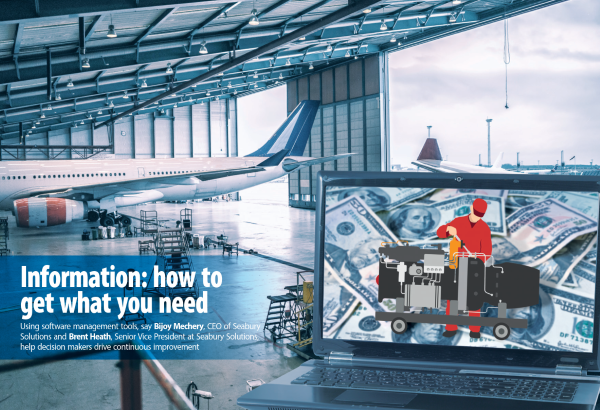
Using software management tools, say Bijoy Mechery, CEO of Seabury Solutions and Brent Heath, Senior Vice President at Seabury Solutions, help decision makers drive continuous improvement
Imagine that your cash collections are three months behind; you have two weeks to meet the payroll; IATA’s going to be after you in a month’s time; your customers are asking for more and more details before they make any payment; and your systems don’t seem to cope well with those requests. This is a scenario that we at Seabury face almost every day when we get calls from potential customers describing these sorts of situations and, often, there’s not much time to deal with them.
SEABURY SOLUTIONS
But, I run ahead: first, some information about Seabury to set the scene. Seabury Group was founded in 1995 by John E Luth, ex-CFO at Continental Airlines. The business started in New York with just four people and the very first job was a pivotal role restructuring Continental Airlines. After that, the business undertook work with a few airlines (large and small) and started growing. In 2002 Seabury Solutions was started with the mandate to build software solutions for the aviation industry.
Last year, Seabury Solutions was launched, based in Amsterdam; and shortly after that, an MRO software company based in Cordoba, Argentina joined the group. Seabury Solutions offers a range of products and solutions. EPAS (Enterprise performance Analysis System) is a performance analysis and management tool that helps decision makers drive continuous improvement to the organization and is used by some of the world’s largest airlines. eAuthority is an all-encompassing solution for civil aviation authorities to manage aircraft registrations, licensing and oversight. Alkym is an MRO product: a comprehensive, full functional integrated, cost-effective aviation maintenance management software solution. There are other software products available and under development all focused on the aviation market.
Wanting to ensure we incorporate the latest and greatest technology all our products are continuously under development. It is part of the Seabury philosophy to regularly invest in their solutions so that they are always at their best. Seabury started an MRO practice in 2003 with a number of overseas projects for a team that is based mainly in Europe and in the USA. Most of the MRO practice people have lived in the MRO environment, they’re ex MRO and airline employees: Seabury believes in having people with real experience; people who have lived in that world, to go and solve the problems faced in MRO.
SOME QUESTIONS AND SOME ANSWERS
EPAS (Enterprise Performance Analysis System)
For the purposes of this article, let’s introduce what we do with EPAS for our client airlines. Some readers might not be familiar with Route Profitability but, we’ve implemented EPAS at a number of large carriers (American, Delta, Southwest…) where it is used to drive route profitability. Route profitability in an airline is about continuously measuring and managing the network performance. It means asking questions such as…
- Which routes are profitable?
- Is this the right equipment for this route?
- Where are costs increasing or decreasing?
- What is the impact of a new competitor in our market?
- How efficient is the operation?
- What is the impact of delays on profitability?
- How beneficial are flow passengers on unprofitable routes?
In short it means asking ‘where can we be more profitable; where are we not profitable now; and what decisions need to be taken in order to address these issues?’ EPAS is a tool and a model that brings in all of that transactional data, builds it out and drives it to a flight by date, by passenger and so on… that’s the atomic, granular level of data which we build up in order to report on things by equipment, by aircraft, by operating carrier, by region, etc. Take de-icing as an example of using that model. De-icing is a type of cost that needs to be allocated not to stations such as Miami but rather to stations such as La Guardia because that’s where the cost is going to be incurred and the model is what drives that to the right place.
All of the costs of an airline (including maintenance, fuel, pilots, flight attendants) all get allocated to a flight and built up for profitability analysis. The question is, ‘can a model for maintenance operations use the same techniques as for calculating route profitability in order to better improve performance?’ There are several challenges within maintenance organizations that might inhibit the ability to do this.
Maintenance performance analysis
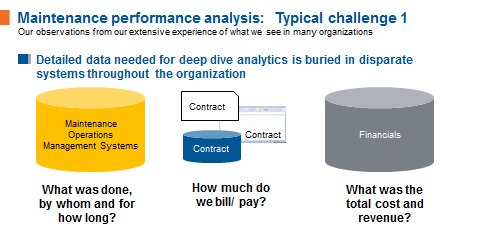
Figure 1
Note: Slide with new Logo and Web site to be provided.
First, maintenance related data is spread all over the organization. There are maintenance operations management systems that capture what was done, by whom and for how long (see figure 1). Then there are contracts either in a contract management system or being kept in Excel spreadsheet and the like: but those contracts determine how much the organization will have to pay and how much it will receive. There are also the financials; the general ledger, the accounts (including accounts payable). The question that is not easily answered but which is very relevant in our world is, ‘What is the profitability for this particular project?’ and, ‘Out of the projects that are currently underway, how many of them are running on time and/or on budget?’ also, ‘What is the fully allocated cost by base, by aircraft, by customer, etc.?’
From our observations and experience we see that people build solutions in a data warehouse; we’ve all done this, i.e. build a data warehouse to bring all that data together (see figure 2). But what we have also found through a number of projects is that, even with a data warehouse, data is still not available at the right levels. In short, putting the data into a single source doesn’t really help; it just means three different data sources (maintenance management, contract and financial data) in one environment; even though it’s in one place, that doesn’t mean that it’s integrated to allow a user to answer the sort of questions posed above.
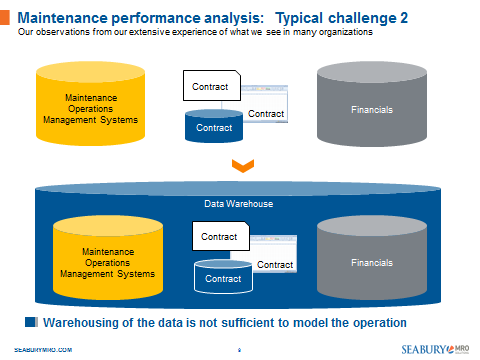
Figure 2
What happens as a result of that is a snapshot analysis. Readers will be familiar with the scenario where a vice-president or executive wants to know perhaps something along the lines of, ‘what’s the fully loaded man hour rate?’ That trickles down to an analyst who pulls data from each of the individual systems to put it into an Excel spreadsheet; from that he’ll put the combined data into a bigger Excel spreadsheet on which he’ll undertake some integration and analysis; and from that he’ll build out a presentation for the VP or executive. Then, the VPs and executives will ask for clarifications to do which the analyst will put more data into more spreadsheets, build more analyses and more presentations as a result of which, by the time that final presentation is completed all of the data that backs it up is weeks or months old, so no longer useful or relevant.
The decision that was originally required might well now be answered but, by the time the next question is asked, the analysis and all of the work completed to deliver it is useless and, all too often, just thrown away for the task to start over again. So, we come back to the original question, ‘can a model for maintenance operations use the same techniques for maintenance as for calculating route profitability in order to better improve performance?’
Shared drivers for profit and decisions
There is, perhaps, more similarity than one might think between the two sides of this business; flight operations and maintenance operations as can be seen from figure 3.
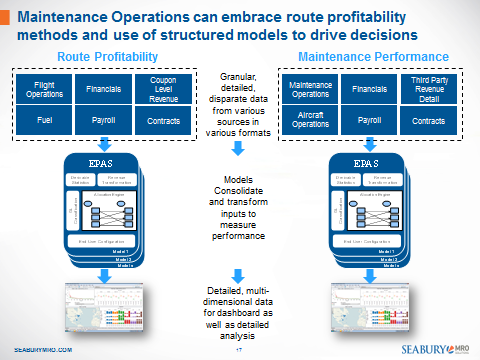
Figure 3
Both areas generate revenue whether it’s coupon revenue in Operations or third party revenue in MRO; and both sides of the business have contracts, payroll… the list is long. And, when all of this data is gathered together it can be put into models. So just as transactional data is taken and put into route profitability to build analytical results for operations, the same can be done in maintenance. At Seabury, we’ve been revealing route profitability for over ten years and, more recently, we’ve been doing the same for maintenance operations profitability.
Within these models, where the transactional data is being taken, it is being modelled to generate integrated results, not the individual silo results of two separate data and analysis environments but an integrated result to show what are the true costs of any event, action or task. That, in turn, allows users to undertake reporting from which it is possible to build dashboards, analyses and all of the other values in a living real-time model rather than a quickly outdated snapshot. When there is a model, there is a consistent flow of data into the model to continuously generate results.
USING A MODEL
Readers might wonder, what is a model in this context?
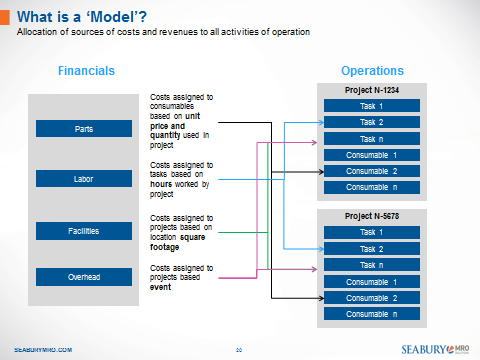
Figure 4
In a model, such as the one illustrated in figure 4, we take financials (see left side of table) which are typically booked in an account at cost center level and aggregated; things like parts, labor, facilities, overheads, etc. On the other side there are activities in the operations such as tasks, man hours, consumable consumed on a project, projects, events, aircraft operations… all types of activities that occur within a maintenance event. The purpose of the model is to help determine the proper allocation of costs from the general ledger (booked at a high level) down to the individual transaction level. Just as in flight profitability that takes costs booked in a general ledger and allocates them to a flight, this model can take costs and allocate them down to a maintenance or engineering task. That allows users to apply it to a project, to an event, to an equipment type, to a project type or whatever it is that needs to be better understood.
As an example of an allocation, take facilities where costs are assigned to a project based on location square footage: just as with de-icing (see above) where you only want to allocate a cost to the station where it is consumed, a facilities cost would be allocated perhaps based on square footage. So, differentiating between big heavy checks which take up a full hangar versus an engine check which uses a smaller space is one type of allocation to do for those operations. It doesn’t have to be square footage, it might be something else; but that’s the purpose of a model, it allows you to change and alter what’s in that model to drive the allocations as you see fit, to properly reflect the operation of your business.
Driving decisions
Remember, above we talked about ‘what is the fully loaded man hour rate?’ From what we’ve seen before, that requires a detailed analysis, pulling the data into spreadsheets and all that. With Seabury’s tool, that data will be continuously driven through and users are continuously able to see those results (see figure 5) without the need for the ongoing repetitive analysis that was needed before. This makes it much easier to use good quality and up-to-date data to drive and support decisions.
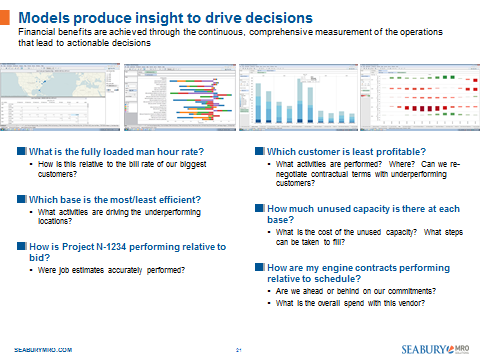
Figure 5
EXAMPLES, CASE STUDIES AND MYTHS
To illustrate the point (see figure 6), we’ll use some examples and case studies from Seabury’s experience using the EPAS maintenance model ‘MPAS’ (Maintenance Performance Analysis System).
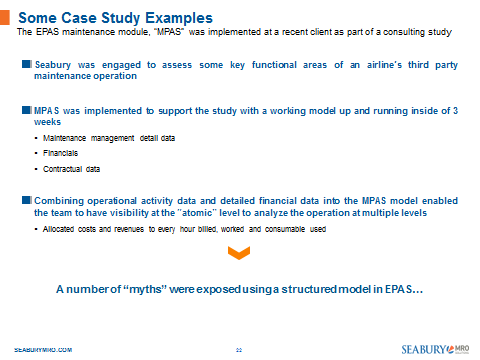
Figure 6
Seabury was involved in some projects recently where the performance analysis products were set up as part of a consulting engagement and we were able to establish an initial working model within about three weeks. What we discovered in doing that was some myths about what goes on within a maintenance organization.

Myth 1 – the cost of a fully loaded man-hour
The first myth was that one organization thought that their fully loaded man-hour cost was $49 per hour. However, when the analysis was completed, it was discovered that that rate was, in fact, $54 per hour. But, if the man-hour rate is in fact $54, when you’re billing and when you’re bidding on projects in the belief that $49 is the break even, the business will soon be in trouble. This was a revelation to the client: the problem was that the $49 figure had been based on anecdotal evidence with management believing that there had been an analysis completed in the previous year and it wouldn’t have changed. Also, the business was not fully accounting for overheads and ‘slack’ time in their ‘fully loaded’ rate. With a continuously updated model, the myth would never have existed let alone persisted.
Myth 2 – where to find the profitability measurement
In the second myth, an organization believed that it could see its project profitability in the financials. Although the data was there (see figure 7) in the financials it was buried at the transactional level of the general ledger and not usable for profitability analysis: it was not at a project level and was never available at a task level. Also, the data that was there could not be connected to individual projects, tasks or activities so could not be assembled in a way that would support proper analysis. Most importantly, it wasn’t being done, anyway; even though they said they had the information, they weren’t using it. They were looking at the wrong things. What the graph below shows is a number of projects over 2015 and the very start of 2016 with each project shown as a colored block on the chart and its profitability (or unprofitability) shown by its position above (profitable) or below the baseline. Behind that are all of the allocated costs, overheads, labor, consumables; everything that has been added into the system to generate profitability: and it’s possible to drill back through each project to see why one project is profitable while another one generates a loss.
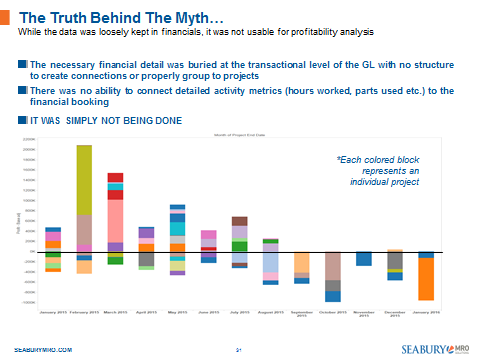
Figure 7
Myth 3 – all bases are the same, aren’t they?
The third myth was that, across several maintenance bases, they were all equally managed to ensure maximum resource utilization. Using the available data as in figure 8, the MPAS model revealed a different story.
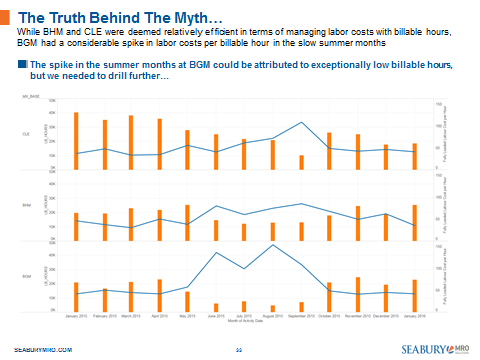
Figure 8
Looking at three bases (we’ll call them CLE, BHM and BGM – they’re not the real bases for this organization) the first two look fine; the orange bars in the table represent the number of billable hours and the blue line represents labor cost for billable hours and those numbers are relatively flat. However, in the third base (BGM) there is a spike in the summer months for labor cost of billable hours because the billable hours drop significantly in those months. Now, we can drill into this.
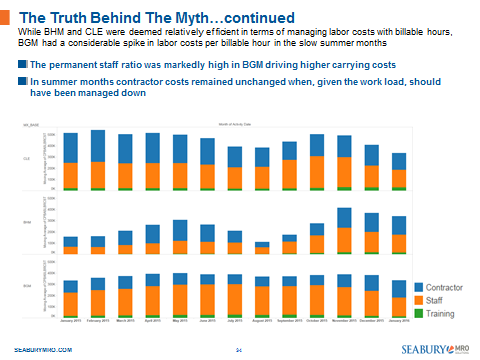
Figure 9
So, in figure 9, we broke it down into categories of staff; Contractors, permanent Staff and Training. In the first two bases (CLE and BHM), it turned out that the contractor mix was quite high, which offered some flexibility to reduce staff levels in the summer months. However, in the third base (BGM) the contractor mix was very small against a higher ratio of permanent staff which offered very little flexibility to vary staff levels according to the workload. This is useful information which suggests a management action item to, over time, change the staffing mix; replacing any losses of permanent labor with contract labor to increase the flexibility available in summer months.

SUMMARY
These have been some typical examples, typical myths from our own experience and case studies. But, perhaps what readers need to think about is, how to find and dispel the myths in their own organization. You conduct your operations and have maintenance and management systems but you need to measure your performance using a mechanism that uses a model to ensure that you are in a continuously informed and continuous improvement mode. It is very important for any of us to measure our performance and by parameters that allow us to understand the real drivers of that performance.
Contributor’s Details
Bijoy Mechery, CEO
 Bijoy Mechery joined the Seabury in 2002 as a Managing Director as well as Chief Executive Officer of Seabury’s IT software consulting and development firm, Seabury Solutions. Mr. Mechery has more than 30 years of IT experience and, prior to joining Seabury, was with Cap Gemini Ernst & Young (CGEY) transportation practice and Ansett Australia Airlines (Ansett). Prior to that, Mr. Mechery worked with Lloyds of London and with the National Bank of Kuwait.
 Brent Heath, Senior Vice President
Brent Heath joined the Seabury Group in 2002 and has over 20 years of Information Technology experience including project management, product development, IT strategy and systems integration. Prior to joining Seabury his previous roles included Senior Manager of Financial Systems at Continental Airlines and Management Consultant for Ernst & Young and Cap Gemini Ernst & Young.

Seabury
Seabury Solutions
Seabury Solutions is a leading global aviation software development and consultancy company. It was established in 2002 and forms part of the Seabury Group. In that time Seabury Solutions has built a reputation as the vendor who delivers cost effective world class aviation management software. The integrated product range includes:
The network of offices is located in Ireland, Netherlands, Argentina, USA and the Philippines.
The Seabury Group
Seabury Group LLC is a leading global advisory and professional services firm delivering diversified and responsive business solutions to clients in Aviation, Aerospace & Defense, Transportation, and related industries. Seabury Group LLC was founded in 1995 with two principal groups, Seabury Advisory Group LLC and Seabury Capital LLC.
Comments (0)
There are currently no comments about this article.
To post a comment, please login or subscribe.