Articles
| Name | Author |
|---|
Why tail-specific performance models matter
Author: Dr. Emil Kaptur, Head of Research and Development, StorkJet
SubscribeDr Emil Kaptur explains how understanding the performance of each specific aircraft in a fleet can optimize fuel and time costs.
‘Tail-specific performance model’ is an innovation, which has become increasingly popular in the aviation industry. However, readers might wonder what exactly performance models are and what does it mean when they are described as ‘tail specific’?
The main goal of a performance model is to calculate fuel consumption over time at defined conditions. For example, if you would like to know the flight time, distance and fuel burn of a descent; you need a performance model. If you put in to the model an aircraft’s weight and speed, and a weather forecast, you will get information about how your descent profile will look. Because such a model ‘knows’ how much you will burn under every possible condition, it can calculate the speed that will give the lowest fuel burn or cost.
So why there is so much discussion about tail-specific models? In a nutshell, each aircraft is different from the others: some have higher drag; in others, engines are a bit less efficient and some are modified beyond their legacy performance model. All of these factors have an impact on fuel burn. If you put all aircraft of the same type into one model, you lose what makes each aircraft individual. With tail-specific performance models, you get the highest precision of fuel consumption calculation. While FMS or Flight Planning Software usually have one legacy model for all aircraft of a given type, nowadays it is possible to get a separate model for each tail number, each engine and each APU.
While legacy models were mostly used for calculating approximate in-flight fuel consumption, by using machine learning and big data from QAR/FDR the new generation of tail-specific performance models can answer many more questions:
- What is the true difference in fuel consumption between single and dual engine taxi, taking into account uphill and downhill gradients, engine aging and APU model?
- How fuel burn depends on intersection take-off, flaps and acceleration altitude for any airport?
- By how much tail-specific optimums differ from FMS speed and altitude and what penalty does that incur?
- What is the accuracy of flight planning’s fuel policy calculations?
- Does the low setting of air conditioning packs include fuel saving?
Let’s look at some real cases to see how tail-specific performance models can lower airlines’ costs.
INDIVIDUAL DEGRADATION FACTORS DELIVERED ASAP
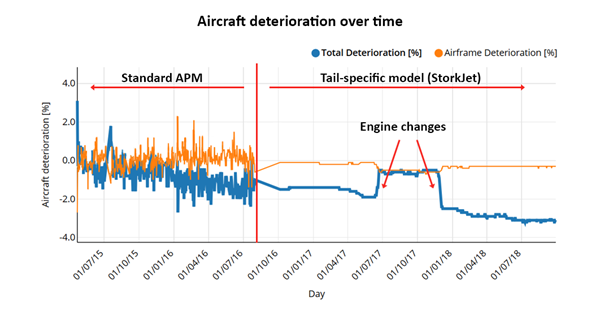
In the traditional Aircraft Performance Monitoring (APM) process, the degradation factors can vary from month to month by as much as 1%. As a result, airlines need to average the results over one or three months. It means, that when there is a large change in aircraft performance (e.g., by 2% if there is an engine change to a more efficient one), the airline will fly for even three months, planning 2% more fuel than needed. In the opposite situation, when degradation would increase by 2%, pilots could notice overburns and as a result, start to plan higher discretionary fuel. Both situations result in a fuel penalty.
With tail-specific performance models, airlines can very precisely determine the performance of an aircraft at any specific point in time. On the chart below (figure 1) you can see that, after an airline switched from traditional APM to tail-specific models, aircraft deterioration calculations looked much smoother. Also, there were two engine changes, with more than 2% change of Total Deterioration visible on the first flight after the maintenance action. Thanks to that, airlines can change the fuel factor on their flight plan right after any changes occur and, as a result, save fuel.
OPTIMUM SPEEDS AND ALTITUDES DESIGNED FOR EACH TAIL
Another case where individual aircraft characteristics matter is Flight Profile Optimization. Let’s analyze real data from two aircraft of the same type. For the same gross weight, route and weather conditions both flight plan and FMS would give the same ECON speeds and altitudes for them.
On the chart below (figure 2) you can see what is the actual Direct Operation Cost (fuel burn + cost of time) for these aircraft. As you can see with the grey points and dashed lines, the economical speed on cruise differs by up to 0.01 Mach between the two aircraft. It shows that these two aircraft of the same type are in fact very different.
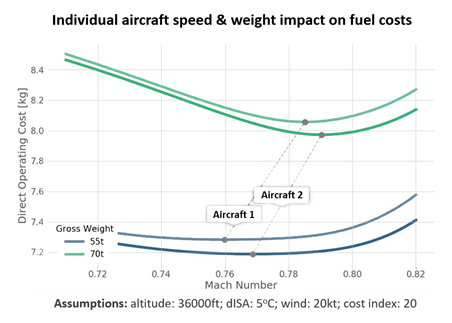
When we delve deeper onto how much can be saved as a result of this difference, the saving potential of AC-2 is 20% larger than saving potential of AC-1. By using tail specific performance models airlines can see such difference and advise pilots to fly differently (in this case a bit faster) on AC-2 to realize all of the possible savings. This can be done by scheduling AC-2 on flights with a bit higher cost index.
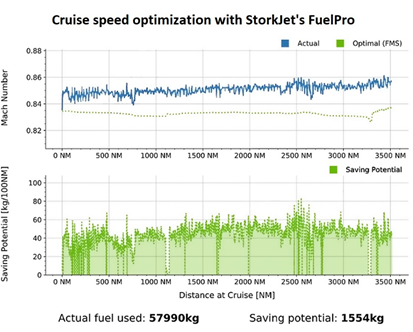
As readers know, pilots are the key players in fuel efficiency. But they also need to understand what impact their behavior has on fuel consumption. With machine-learning models, pilots, after each flight, receive a comparison of their flight path flown with the most optimum one. Such charts can optimize flight speed and vertical profile during climb, cruise, and descent.
Below (figure 3), an example of the cruise speed optimization chart is presented. The optimum speed is marked as the green line while the blue line represents the actual one selected by the pilot. The green area is the saving potential, which in that flight is equal to 1554 kg. With such information, pilots can check where the areas for improvement are and what actions might have the biggest impact on CO2 reduction.
TRUE SAVINGS FROM SINGLE ENGINE TAXI
It is common knowledge in the market that while taxiing with a single engine, an airline will save, for example, 5 kg per minute of taxiing time on a medium range aircraft (after a cooling period). However, this might lead to wrong conclusions, because taxiing on a single engine takes longer than a dual-engine taxi, which generates a fuel penalty. Some airports might have uphill gradients, in which case single engine taxiing will be even slower. Or, on the contrary, there might be traffic on some airports – in that case single engine taxiing generates more savings because the aircraft will be in a queue but only on one engine.
With creating dedicated models for taxi, it is possible to take into calculation all above mentioned relations (figure 4). When a pilot performs dual engine (grey line), he might compare it to the single one, which is fully simulated (the blue one).
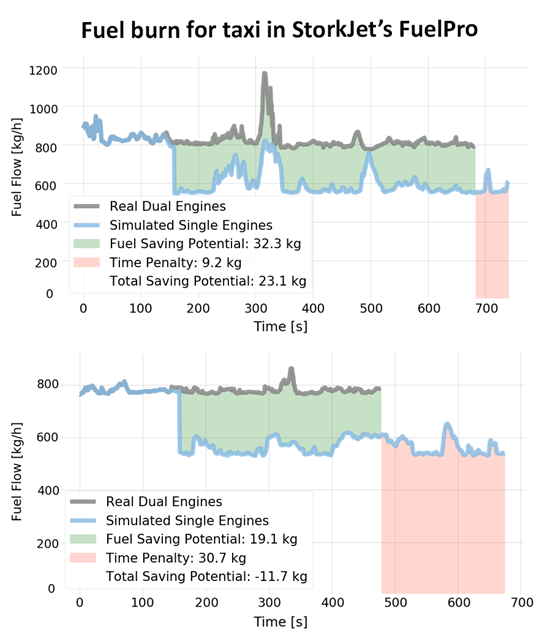
On the charts, we can see what is the fuel saving potential (green area) as well as the additional fuel that needs to be used because of longer taxi (red area). The top chart shows an example when a pilot in total saved 23 kg of fuel. The example under that shows a case when single engine would generate fuel penalty equal to 11.7 kg. On the contrary, in the traditional calculation approach both cases would show the same fuel savings.
Thanks to apple to apple comparison calculated for each flight and for each fuel initiative, analysts can easily find those areas of operations where the biggest savings are hidden.
Contributor’s Details
StorkJet
StorkJet is the expert in aircraft performance and fuel efficiency based on real flight data. With artificial intelligence they support airlines through revealing new saving potential opportunities and optimizing flight operations. Airlines use StorkJet’s software to save on over 44 fuel initiatives, monitor the performance of each aircraft in the fleet and engage pilots to be more eco-friendly.
Comments (0)
There are currently no comments about this article.
To post a comment, please login or subscribe.