Articles
| Name | Author | |
|---|---|---|
| CASE STUDY: Managed MRO IT as a service at Western Global Airlines | Jim Buckalew, SVP Technical Operations and Technology, Western Global Airlines | View article |
| CASE STUDY: Improving resource utilization and efficiency at Delta TechOps | Rick Uber, General Manager Base Maintenance, Delta Airlines and Dinakara Nagalla, CEO of EmpowerMX | View article |
| WHITE PAPER: A paradigm shift to more efficient aircraft fleet maintenance | Christine Windmeijer, ReMAP’s Public Relations | View article |
| White Paper: IT systems adoption Part 2 | Allan Bachan, VP, Managing Director, MRO Operations, ICF | View article |
| White Paper: Sustaining aviation after recovery Part 1 | Gesine Varfis, Marketing Manager APSYS and Gabriel Godfrey, Product Owner – Sustainable Aircraft, APSYS | View article |
| Case Study: Finnair enhances aviation safety | Kjell Skogberg, Manager, Production Support, Technical Operations for Finnair | View article |
White Paper: IT systems adoption Part 2
Author: Allan Bachan, VP, Managing Director, MRO Operations, ICF
SubscribeAllan Bachan, VP, Managing Director, MRO Operations, ICF considers the rate of technology adoption through Covid-19 and how to optimize system adoption.
In part 1 we looked at discovering how well processes in the business are IT enabled through an understanding of the current positions for business processes and the IT systems that support them. In this part we will continue with the adoption study, looking at the ‘as-is’ blueprint, measures and gaps, adoption improvement, and EPC support.
Building the ‘as-is’ blueprint
The ‘as-is’ blueprint is key in the adoption study: how each task is done, meaning the use of software in the performance of the task, is captured in the mapping. All dependencies as configured for each screen or program, including tables, workflows, settings, options, etc., contribute to the blueprint. It’s worth noting that this is also the way we recommend to design a ‘to-be’ solution when systems are being implemented. In this series of articles, we’re referring to a system that is already in place, already being used so it’s really reverse engineering what the blueprint is. Some configuration options may be mandatory and some may be optional; it is important to identify which are which.
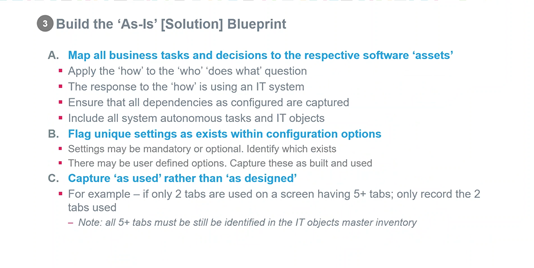
Certain systems may also afford the ability for users to create their own fields, tables or attributes. These should also be used: for example, you might have a field that asks for ‘Check types’ – A checks, intermediate checks or line checks or so on – and these, again, are user customizable fields that you want to capture in the way that you use them and what you put in them.
Because we are doing a GAP study of how many tasks are enabled by technology objects, even if only some features and functions are used, it’s important to make sure that all possibilities are recorded. Therefore, if on an entry screen in the way that you are using it today, there are five tabs of fields that may be entered but only two are used in reality, the ‘as-is’ will only have two recorded but the master file will have all five that are available
Internal measures and gaps
For the internal measures and gaps, now that we have mapped tasks and software objects, we can identify how many tasks are not enabled by technology. We can also identify how well, based on performance criteria, software assets might enable those tasks that are not currently enabled (figure 10).
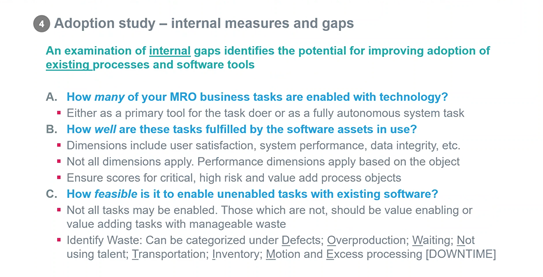
This means that key performance objectives, measurements and dimensions should also be created and applied. One example can be response time of an entry screen where the expectation is no more than three seconds. In keeping with the theme of the important few versus the trivial many, critical high risk and value-added process objects should definitely be scored. Not all tasks can be enabled with existing software now, nor it is a wise idea to have technology for every task. This means, therefore, that waste can be acceptable: however, it’s a good idea to identify waste into different categories. There are several ways people do this and, as you’ll see in figure 10, we can use the acronym ‘DOWNTIME’ to describe waste processes – readers might have their own versions of this. Typical waste will usually fall into one or more of the categories which might also impact performance measures, if there is waste then, naturally, performance measures will be lower.
To summarize, therefore, tasks that are not enabled with technology might lead to lower performance tasks from a business perspective and may contribute to waste in different categories. These will most likely be low-hanging fruit or immediate candidates for improving business process or technology adoption
Industry measures and gaps
The external view (figure 11) is very similar to the internal measures and gaps. It is very important to know what exists in the market place which can be potentially used for processes and tasks that are not currently enabled with technology.
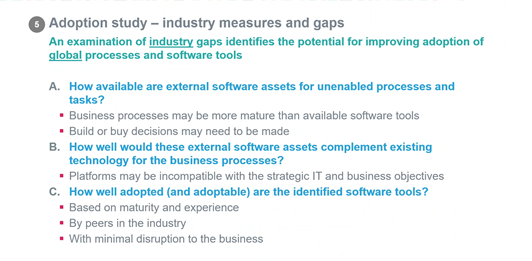
It is advisable to note, however, that diligence must be paid to observe whether your own business processes are more mature than the available software tools. A common mistake is to assume that tasks which might be manually performed today, should be automated. Available software packages, however, might not be capable of fulfilling some robust business processes and tasks in the way that you do it. For example, we have seen some cases where systems have been implemented and productivity has, in fact, decreased. Where systems are identified as available, they should be checked for compatibility with your existing landscape now and in the future. Not only technical compatibility but also the ease of adoption specific to you staff and environment. There have been several projects that have grown from months to years because of these issues.
In figure 12 is a simple example of what a scorecard might look like for a particular function.
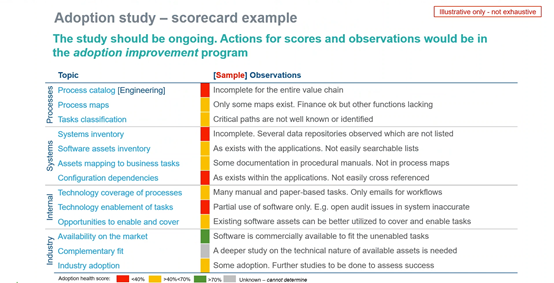
There may be weaknesses with processes, how they are documented and how they are classified plus, there may be weaknesses with technology systems that support those business processes and how these systems are configured to fulfil business processes. You might, in fact, discover that you already have available technology assets that can fulfil business processes very well but that are not well adopted or for which key configuration options are not being used. Several other reports and capability maturity will be available once this exercise has been completed. For example, where there are bottlenecks in processes because of timing and staffing issues or burdensome reporting or manual tasks.
ADOPTION IMPROVEMENT
So now that we have completed this study, we can ask how then do we go about using that information to establish adoption and continuous improvement programs? But before we get into that, it is important to recognize issues relative to implementing IT systems. How many times have we seen announcements declaring success with going live on systems? Well, this article is not to devalue that achievement but rather to build on it. Systems are implemented to achieve business benefits and measurement of business benefit can only happen after go-live (figure 13).
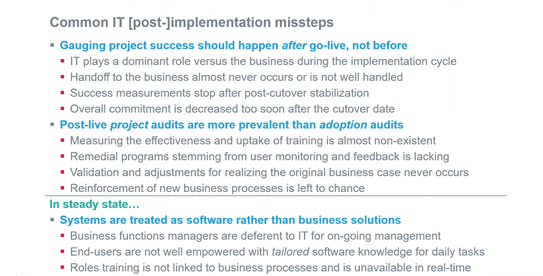
IT typically and rightfully plays a dominant role during implementation but then business users directly experience the results. Success measurements should therefore exist well beyond go-live and key user stakeholders should own performance indicators. If we look at a typical MRO system, it is estimated that the first three years are needed for full adoption across all business functions. We have also seen many post-mortem project audits but we hardly see adoption audits, user support desks, log tickets and follow-up for resolving issues as they are reported. But not many remedial programs and measurement of training uptake exist. Moreover, continuing evaluation of the initial business case is almost never done, and reinforcement of new business processes are left to chance. In some cases, the new system is just that: a new system – people end up doing the same things and getting the same results except on a different IT platform.
Therefore, in steady state, systems should be business solutions and not just software. Departmental managers responsible for business objectives should own the benefits; this means that end-users should be empowered with roles and responsibility based on software knowledge – meaning process driven, step-by-step instructions using the software, not the other way around. That ends up being screen level software navigation only without true acknowledgement of role level responsibilities specific to your company.
How then can we ensure a better adoption experience? There are several key characteristics we recommend in addition to usual software management, which will encourage better adoption (figure 14). These are categorized in three broad areas: conditions, ownership and operations.
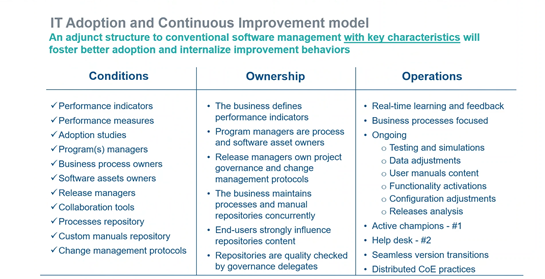
We recommend having a check mark against all of the conditions applying the philosophy of ownership and operations as stated here.
For example, do you maintain a processes repository or carry out adoption audits? How about performance indicators and measures for business tasks and the associated IT systems? Similarly, as we’ve already mentioned, are the system performance expectations owned and defined by the business? When patches and system releases are done, are these managed primarily by IT or jointly by user departments? Who refreshes user manuals, processes and procedures? This should be embedded in daily ways of working and not isolated projects. There should be a continuous loop of user feedback, improvement committees and ongoing collaboration across all stakeholders. Not every request should go to the helpdesk: there should be active champions close to the point of use as the first channel for assistance, then the helpdesk needs only to get involved if there is no resolution.
The overall structure should engage center of excellence practices as a natural way of working; there should be a continuous activity cycle of testing and simulations, detailed adjustments and corrections, user manuals content, functionality activations, configuration adjustments, and releases analysis. Most software vendors are now doing at least two releases per year. Without a structure to manage these cycles, it is very easy to fall behind and become stuck with a large upgrade project after several missed updates when that large upgrade project resembles a new implementation.
EPC SUPPORT
We will now highlight some of the features of the EPC (Enterprise Process Center) tool that supports the adoption study and improvement models presented earlier. There are seven key questions that we will address to show how the tool supports the adoption model – this is not an exhaustive list.
1. How do you populate EPC with processes and software objects?
You may have pieces of this information available in several forms and places; processes or your procedures or, of course, your data as far as system objects and so on… transactions or screen lists. How do you easily bring that data into this model? My first question on populating EPC, you don’t want to have to manually do that.
2. How well are your business processes performing?
Once the information is in the tool, how can you see the performance of your processes and how well they are performing?
3. How well are you using available systems and technology?
4. How well do users know the processes, procedures and systems?
Users need to easily know and follow processes, procedures and of course, how they do this within the system so how is that facilitated in EPC?
5. How well are you managing improvements to processes?
How to go about managing improvements once the user is using it. They’ll have feedback and then, of course, there will be changes
6. How compliant are you with policies, rules and regulations?
Most processes in maintenance are regulated, so, whenever policies change, procedures rules and regulations have to be affected. How compliant are you and how can you maintain compliance?
7. How up-to-date are you with system changes, revisions and updates?
Last but not least, the environment is very dynamic so how up-to-date are you with systems changes, revisions and updates and how does this tool allow you to do that?
These seven questions are very relevant. This is not exhaustive but the above copy has all been looking at all the different things that you do for an adoption study and, of course, adoption improvement. This is how EPC facilitates you being able to do that.
In part 3 we will consider the seven key questions above in detail with some suggestions as to how users might be able to deal with each one. We’ll then summarize the Adoption Study and its potential to help users match software to functions, processes and tasks as well making full use of the IT assets already in the business.
Ends…
Contributor’s Details
Allan Bachan

Allan is a Vice President at ICF with 32 years of industry experience as an Aviation M&E, MRO and Supply Chain solutions and systems domain expert. He is responsible for ICF’s MRO Operations and IT practice and he manages the Aircraft Commerce Consulting relationship with ICF. His experience includes managing application design, development, and full cycle implementation – from selection to go-live – for strategic clients in the MRO industry using different commercially available MRO IT products. In his career, Allan has fulfilled the following leadership roles: MRO IT practice and technical lead; MRO systems Product Principal; M&E and MRO Solutions Director and Manager of Technical Records, Maintenance Planning and Production Control.
ICF

ICF is a global consulting services company with more than 5,500 specialized experts, who are not typical consultants. They combine unmatched expertise with cutting-edge engagement capabilities to help clients solve their most complex challenges, navigate change and shape the future.
Comments (0)
There are currently no comments about this article.
To post a comment, please login or subscribe.