Articles
| Name | Author |
|---|
Optimal flying saves fuel and time at Norwegian
Author: Stig Patey, Captain B737 / Manager Fuel Savings, Norwegian
Subscribe
Stig Patey, Captain B737 and Manager Fuel Savings at Norwegian shares the airlines experience leveraging a Flight Cruise Profile Optimizer solution
In this article, I want to share with readers what has been a very successful implementation, leveraging an in-flight cruise profile optimizer solution at Norwegian. Given that the COVID-19 pandemic has distorted so many outcomes and especially in the commercial aviation sector, all the numbers in this article are pre-COVID, so will be relevant for comparison with normal times. But first and for context, let me explain a little about the airline that is the subject of this case study.
NORWEGIAN
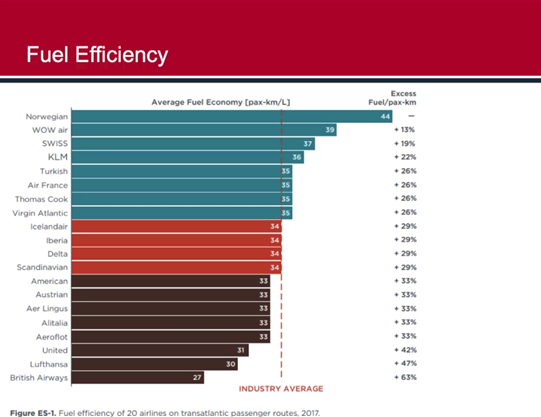
Norwegian is the fifth largest low-cost carrier in the world with around 10,000 employees, flying 500 routes, serving 150 destinations in Europe, North Africa, the Middle east, Asia, the Caribbean, South America, the US and Canada. Norwegian has been ranked the most fuel-efficient airline across the Atlantic (figure 1).
This is, in part, due to the fleet of very fuel-efficient aircraft but also to how those aircraft are operated, which is the subject for this article. Norwegian’s fleet includes Boeing 737 800 and 737 MAX aircraft.
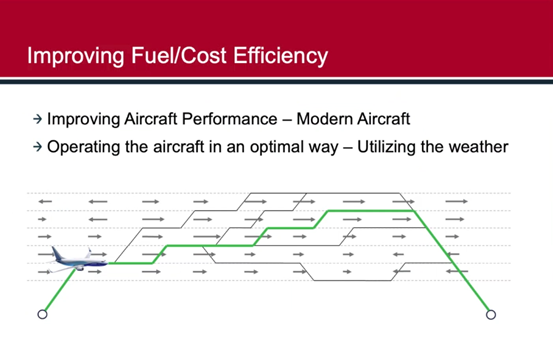
IMPROVING FUEL AND COST EFFICIENCY
If airlines want to improve the fuel and cost efficiency today, it’s not enough on its own to be flying a brand-new, efficient aircraft but it is also sensible to optimize how the airplane is flown. As you can see, figure 2 depicts an aircraft flying at different altitudes utilizing the weather and flying the optimum area and level for the flight.
So, what sort of projects does Norwegian undertake? A lot of vendors approach airlines with this or that product to save 2 percent of fuel. In order to determine which solution, if any, might be suitable for their purposes, Norwegian ran a trial. The problem was, as you can see in figure 3, is that there are significantly different wind speeds at different altitudes, even at the same way point or location.
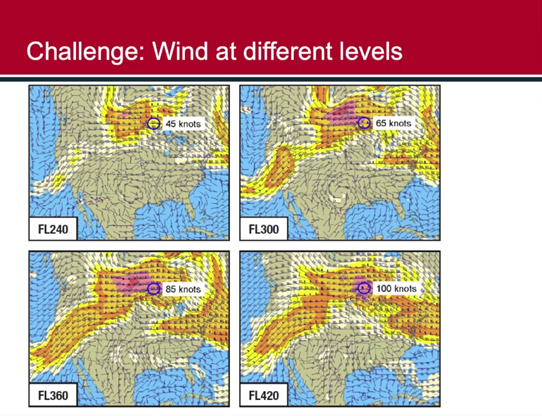
In the case used for figure 3, that variation ranged from 45 knots to 100 knots. For a pilot, if they’re flying against that wind, they will probably wish to be lower in order that the headwind is less whereas, if flying with the wind, they’ll want to be at a higher altitude to catch that better tailwind. However, as readers know, things are not that simple. Figure 4 shows the wind altitude trade-off that has to be considered.
WIND ALTITUDE TRADE-OFF
If there were no winds at all, aircraft would be flying at the Flight Management Computer (FMC) optimum level which is the best level for the aircraft in terms of its performance in still air with no wind to consider. But let’s introduce the factor of more favorable winds at lower levels and let’s say, for the example in figure 4, if the aircraft is flying 4,000 ft lower than the FMC’s optimum level, there would need to be 15 knots more tail wind or less headwind than at the FMC’s selected level to counter that level change and be at break-even.
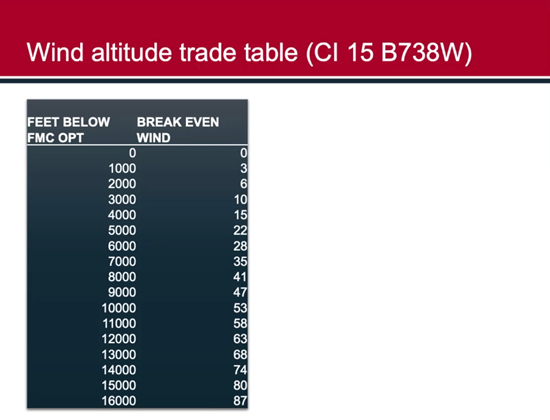
Now, let’s look at an example for a typical wind altitude trade-off. Figure 5 is a table with an aircraft flying at 39,000ft and that’s the optimum level for the aircraft but there is no wind there whereas, at lower altitudes there are more favorable tail winds. The question is, will the tail wind encountered by flying lower not only break even against the optimum flight level with no wind but also deliver a benefit?
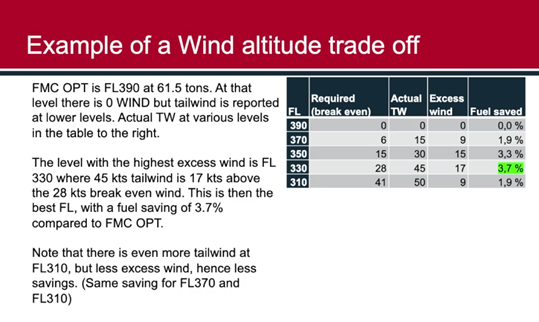
If the aircraft goes just 2,000ft below the current level, to 37,000ft, there would be a saving of 1.9 percent on fuel and most pilots might be pleased enough with that. But what if they could know that by dropping further to 35,000ft, there could be a saving of 3.3 percent on fuel and at 33,000ft, a saving of 3.7 percent? Any further down to, say, 31,000ft, would take the aircraft so low that the added fuel burn would no longer be so well compensated for by the wind. This is a typical wind altitude trade-off; you need to look at the wind at each level, compare that with the increased fuel burn of the aircraft for that level, compared to the optimum level before you correct for the wind and then, after correction what would then be the optimum level. In the right-hand column is a calculation of fuel saved but it will be necessary to consider the full cost component in terms of the cost index.
IMPROVING PILOT DECISION SUPPORT
The challenge for Norwegian was how to better support pilots in the decision as to what would be the optimum level. It’s no use to retrospectively decide that this or that would have been the optimum level if there was no way for the flight crew to have known that on the day of operation. The challenge is that the planned profile from the flight planning system is not optimal because it is based on old weather forecasts; forecasts that are several hours old (figure 6).
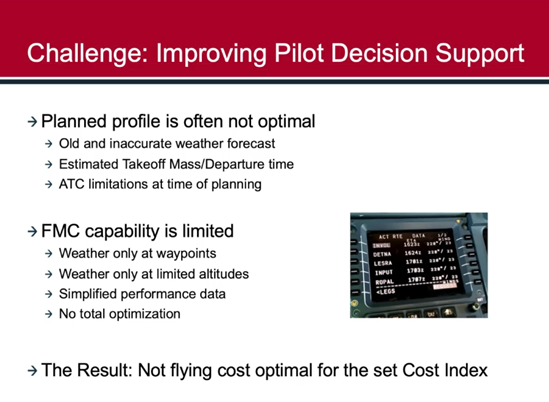
If the flight plan was filed in the morning, the crew fly to the destination and then have to make the return flight back to base, by the time that return journey is started, the plan might already be as much as ten hours old which means that it won’t much help the crew on that return flight. So, having the most accurate information, optimizing the altitude calculation minutes before the flight is airborne or shortly after, will make for a more accurate prediction.
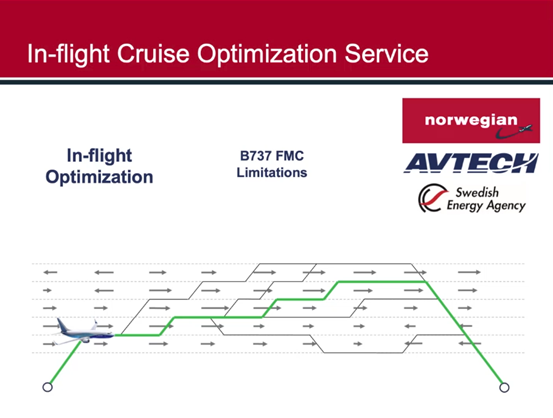
The optimization that Norwegian started to look at was the subject of a collaboration between Norwegian and AVTECH in Sweden (figure 7), and was also supported by the Swedish energy agency. The purpose was to identify the optimum flight path, taking the most accurate weather information into account.
AVTECH’S VALUE PROPOSITION
AVTECH were able to offer a solution that addressed the pain points that Norwegian had identified in this ‘optimum flight level decision’ process (figure 8).
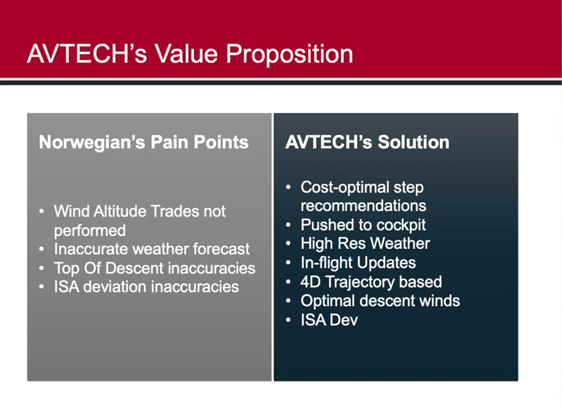
Norwegian knew that crews were not performing the wind altitude trade-offs but the AVTECH solution can identify the optimum positions and locations for a step climb, and send that information directly to the cockpit through an ACARS print-out or send it to the FMC to be displayed on a screen. This information is based on a 4D trajectory with a much clearer representation of winds which are derived from a 10K high resolution model. The current World Area Forecast System (WAFS) provided by the UK Met Office and NOAA has approximately 9 minutes of flying time between each point, whereas the Met Office high-resolution wind data service reduces flying time to under 1 minute between each point. This means that the high-resolution weather data builds a much clearer picture about what is happening along an aircraft’s planned flight path. As a result, pilots are able to make more dynamic decisions based on the prevailing weather conditions.
The system is a ground-based service which has a real-time communication with the aircraft providing a total cost optimal flight path based on the aircraft route, high-resolution weather forecast and high-resolution aircraft performance models (figure 9).
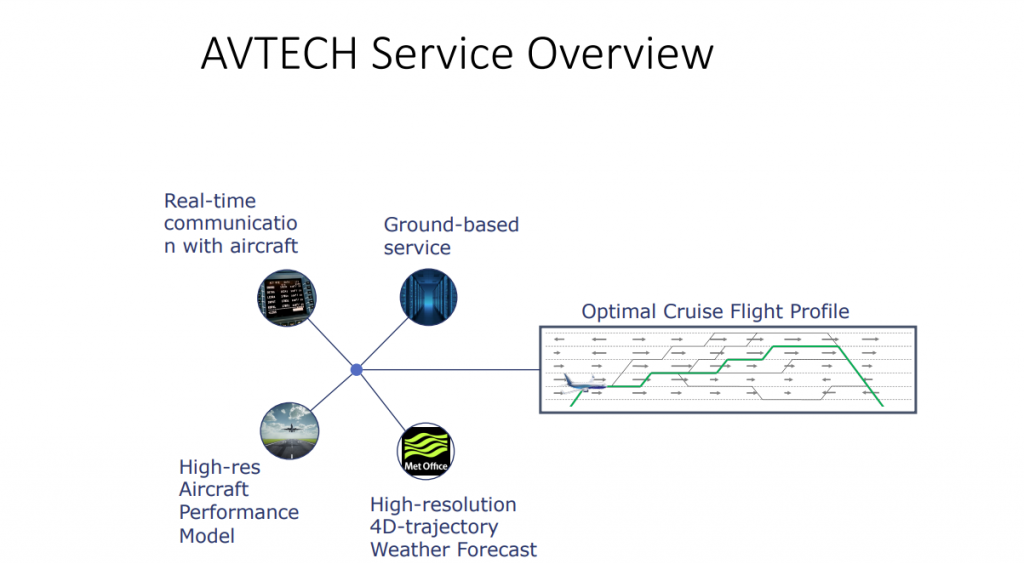
The cruise profile is calculated for the flight with optimum step points which do not need to be at specific waypoints but can be at any position between waypoints.
HIGH RESOLUTION WEATHER FORECAST
Comparing the weather forecast that is the default in the flight planning system (WAFS) which is a 140km gridded data set with the weather forecast in the AVTECH algorithm which is derived from a high-resolution grid, the density of forecast units is approximately 200 times more (figure 10).

The team also looked at the wind data being produced by the flight planning system using WAFS and compared it with the high-resolution weather grid and there was an up to 50 percent reduction in wind error. This level of resolution supports a much more accurate prediction of the wind at a given way point or at any given location which will enable pilots to make more accurate decisions as to whether they should change the cruising level or stay at the current level. If more accurate winds are entered into the flight management computer, for the cruise phase of the flight, flying at the cruise level, there will be no performance gain unless the wind information is used to change level and for better steps; that’s the real achievement. Some believe that if you just have more accurate wind information into the FMC, you’ll automatically save fuel but, at any point in space, the flight management computer will actually use the real wind to apply the algorithms to calculate optimization at any given point. With the wind altitude bands provided aby AVTECH, the pilots are able to determine where to make the step-climbs and descents.
REPORT FORMAT
The report itself is sent to the aircraft (figure 11) before or just after departure. Norwegian experimented with the timings starting with about eight minutes after departure, then down to five and now to three minutes after departure for the report to be delivered to the flight deck.
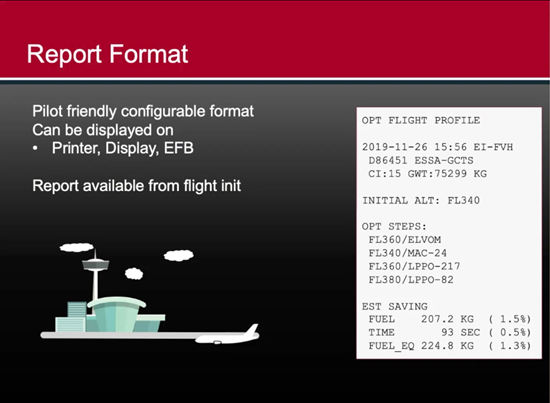
As readers will see, figure 11 shows a profile where the initial altitude in the flight plan was 34,000ft and then there are steps… step up to 36,000ft at Elvom, then drop back down to 34,000ft 24 miles prior to MAC before going up again to 36,000ft 217 miles prior to LPPO and, finally, up to 38,000ft 82 miles prior to LPPO. That would be the profile of the flight and the good thing with this profile is that the print-out also quantifies the estimated savings: this is a comparison between what would be the case if the crew followed the original flight plan exactly and if they used this up-to-date profile calculated by AVTECH. For this particular flight, quite a long one from Stockholm to Tenerife, it can be seen that the fuel saving is 207.2 kilograms of fuel. Those 207kg of fuel for a Boeing 737 is equivalent to 1.6 percent of fuel. There is also a saving of 93 seconds of flying time and, converting those seconds of flying time into the equivalent amount of fuel, using the cost index as a conversion factor, the amount of fuel saved is 224.8 kilos: that’s the equivalent saving for this flight.
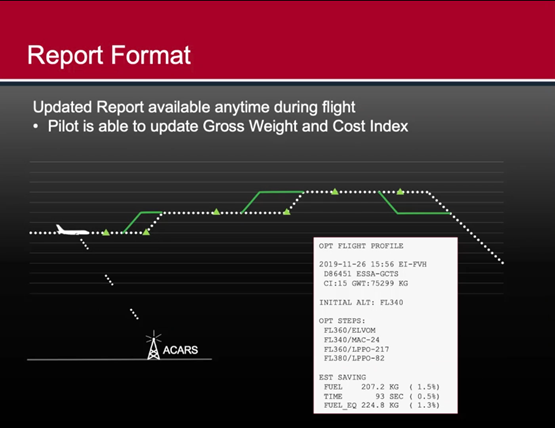
The crew can inspect the printout at the very start to verify that the aircraft weight is correctly recorded and that the cost index also is correct. If either is not correct, they can send a message to change those parameters to the correct ones. The report format is in figure 12 and readers can see that it’s also very easy for the crew to send a short update to the ground whilst enroute. The print-outs are clear and self-explanatory with the wind speeds at each waypoint and optimum altitudes displayed in brackets for the wind altitude trade-offs.
The print-outs also list the most accurate descent winds for the descent and it was with those descent winds that Norwegian first started with the uptake trial. In that, the descent winds were used to make sure that they were the most accurate winds to position the top of descent, including the ISA (International Standard Atmosphere) deviation and the QNH (barometric pressure adjusted to sea level) forecasted. Then the climb optimizer was included, with the step-climbs. Of course, it could be that the flight plan is already optimum in which case, the AVTECH read-out will just be a confirmation of that.
CASE STUDY
Now, I’d like to tell you a little about the system through a case study that Norwegian did, comparing the fuel saved or fuel penalty switching from the Lido flight plan to the AVTECH system used in flight with the optimizer. This looked at a three-month period, December 2019 to February 2020 inclusive (figure 13.1).
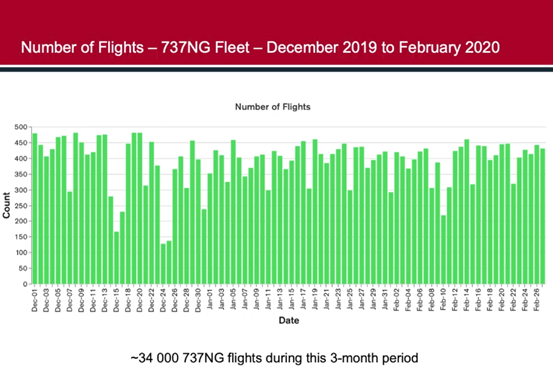
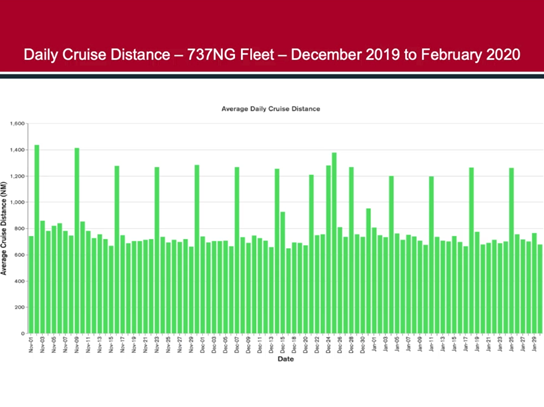
Norwegian operated roughly 34,000 flights with the 737 NG during that period. The average cruise distance flown is shown in figure 13.2 with the higher green bars at the weekends when there are longer average sector lengths.
As a result, there was a very good average saving per flight (figure 13.3).
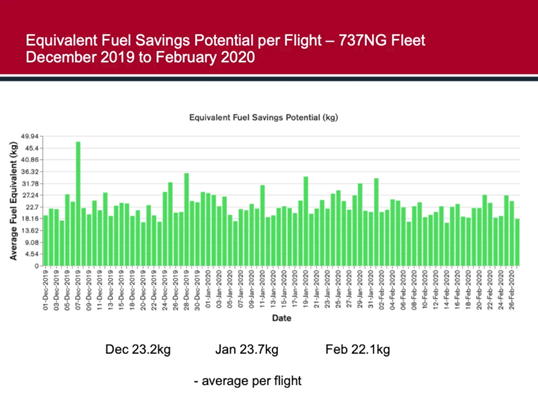
Savings were relatively consistent between the three months. In December the average saving was 23 kilos per flight with 24 kilos per flight in January and 22 in February. That’s the average saving. However, you’ll notice that there are peaks where savings were slightly higher: that could be due to weather and also due to longer sector lengths – with longer flights, more kilos per flight can be saved on average.
Translating these absolute values of fuel saved into percentage values, the average was roughly 1.6 percent of fuel saved (figure 13.4).
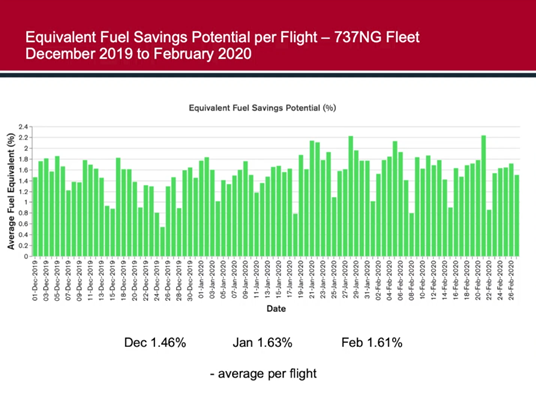
That roughly 1.6 percent is the potential difference between flying to the operational flight plan with no corrections, and following the optimizer. Some flights have more savings than others so figure 13.5 is just a distribution with the savings.
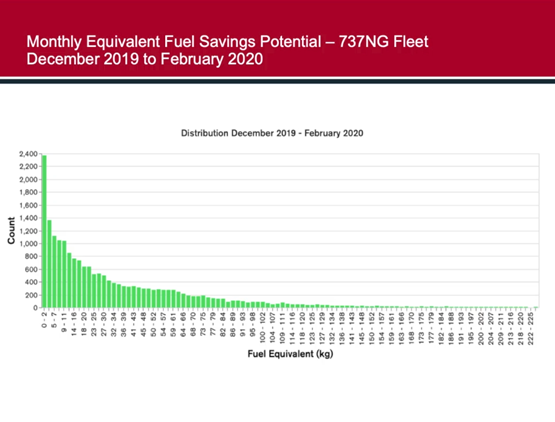
As can be seen, most of the flights had small amounts of savings with, in the end, more and more savings with a longer frequency. There could be some flights at the very extreme ends that might have been a flight plan that was filed as very low due to air traffic restrictions and then the crew managed to climb higher. But the total saving here would be the surface area of that graph which is what was also on figure 13.4.
The monthly total fuel saving with the fleet (figure 13.6) was…
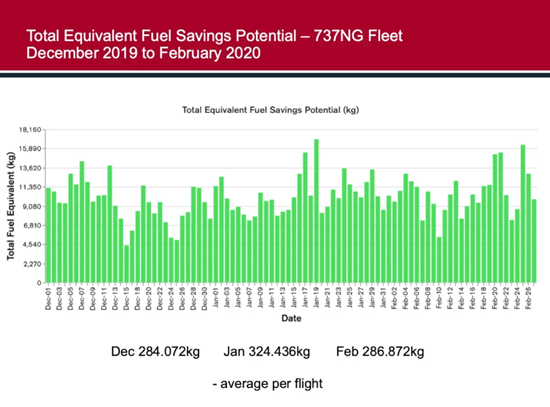
… around 284 tonnes in December, 324 in January and 286 tonnes in February. This was fairly consistent from month to month.
SUMMARY
To sum up Norwegian’s experience with this fuel saving solution so far (figure 14) it was first very easy to get started. Norwegian was able to run the trial with very little effort.
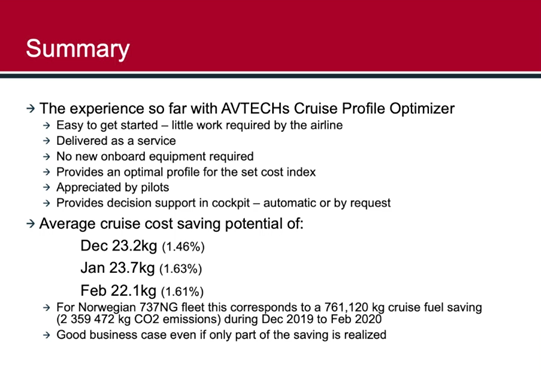
Because the solution is delivered as a service, there is no new onboard equipment required as long as there is an ACARS that can receive the messages or that can be done by other means. The system provides an optimum profile to minimize total cost, not necessarily just the fuel cost but, of course, the fuel cost is the main cost driver. As part of the trial, Norwegian ran a survey among the pilots to gauge their appreciation of the system – it would not have made sense had the pilots not supported it – and they were very happy with it. They could see, for example, that, if the descent forecast said that, at 24,000ft the wind will be 2.2 degrees and 71 knots, and the pilot descended to that level and could see that the actual wind was spot on or extremely close to the forecast, that impressed them and ensured their buy-in to the solution.
The cruise saving potential, as we’ve already explained above, ran out at roughly 23 kilos or 1.4-1.6 percent fuel saving. Just in those three months, 761 tonnes of cruise fuel was saved with 2359 tons of CO2 emissions. Of course, that’s the potential between the standard flight plan and running the optimizer but it doesn’t mean that will be the saving on every flight: that would require everyone to always follow the recommendations to the letter. But there could be Air Traffic Control restrictions that mean a pilot cannot secure the ideal level; however, savings will be somewhere in that potential space between to flight plan and optimized profile which is still a good business case.
Contributor’s details
Stig Patey

Stig has been with Norwegian as a pilot since 2006 and manages fuel and cost saving initiatives in the Company, which currently is ranked as the most fuel-efficient airline across the Atlantic by ICCT. He is mostly in his office but gets the chance to fly as a captain on the B737 now and then.
Norwegian

Norwegian’s route network focuses on connecting key cities and primary airports on both their long haul and short haul network. The airline operates a modern and fuel-efficient fleet consisting of Boeing 787 Dreamliners on the long-haul fleet and Boeing 737s on short haul.
AVTECH

AVTECH, specializes in tailored information to the cockpit, offering easy, automated and inexpensive improvements in FMS optimization. The Aventus NowCast™ weather service gives pilots access to weather data of the highest available quality, to optimize aircraft trajectory, and reduce the fuel burn and CO2 footprint. Working directly with Met Office (UK), the Aventus SIGMA service supplies cockpit crew with severe weather information, based on actual route and time in the FMS.
Comments (0)
There are currently no comments about this article.
To post a comment, please login or subscribe.