Articles
| Name | Author |
|---|
CASE STUDY: Wizz Air gained better performance with a new solution
Author: Jaime Romero Waldhorn, Fuel Efficiency Manager, Wizz Air
Subscribe
Jaime Romero Waldhorn, Fuel Efficiency Manager at Wizz Air explains how the airline moved beyond traditional Flight Management System (FMS) profiles by implementing tail-specific Flight Path Optimization (FPO)
As Wizz Air advanced its fuel-efficiency and environmental-performance initiatives, the airline faced a familiar but important challenge: legacy FMS logic, based on generic performance models and limited weather inputs, did not provide the maximal level of precision needed as would be necessary for a modern ultra-low-cost, high-frequency operation . With over a thousand flights per day and an ambitious Net Zero roadmap, Wizz Air needed a solution that could support pilots in real time and compliment decision-making across climb, cruise, and descent.
To address this, we implemented and deployed StorkJet’s FlyGuide FPO across the Wizz Air fleet of more than 260 aircraft, providing tail-specific recommendations for optimal speeds and altitudes through the airline’s EFB application. By combining high-resolution weather data, machine-learning-based performance modelling, and cloud-enabled optimization across all flight phases, FlyGuide FPO gives pilots both in-flight guidance and post-flight feedback. The result is better situational awareness, more informed operational decisions, and measurable fuel and CO₂ reductions.
WIZZ AIR AIRLINE
In figure 1 you can see the key facts and numbers about Wizz Air.

Figure 1
WIZZ AIR – STORKJET PARTNERSHIP
Since 2019, Wizz Air has been collaborating with StorkJet to enhance operational efficiency and support its environmental sustainability metrics. This partnership focuses on leveraging StorkJet’s advanced tools and technologies – including FuelPro, AdvancedAPM, and FlyGuide – to optimize fuel consumption and improve overall operational performance. The collaboration plays a key role in supporting Wizz Air’s commitment to operational efficiency and environmental performance – see figure 2.
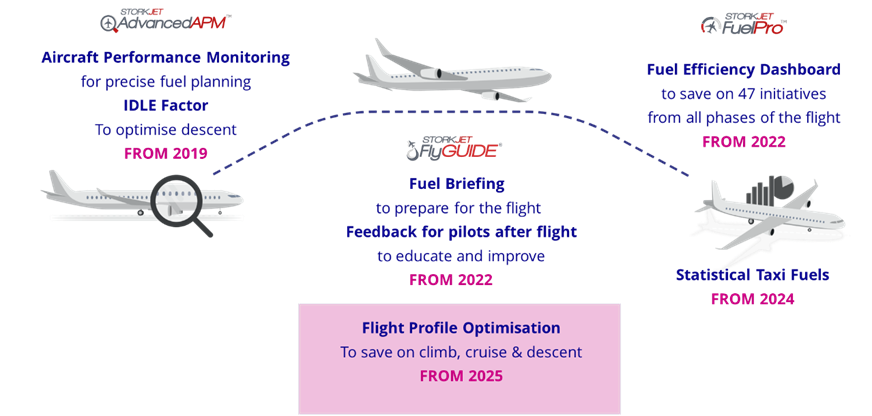
Figure 2
FlyGuide consists of three modules, illustrated in figures 3.1, 3.2 and 3.3, supporting pilots before, during, and after the flight. This case study focuses specifically on the Flight Path Optimization (FPO) module.
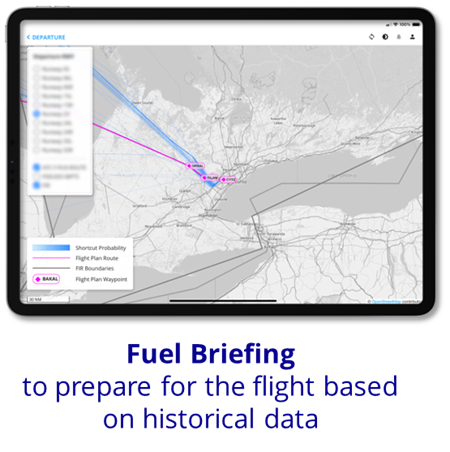
Figure 3.1
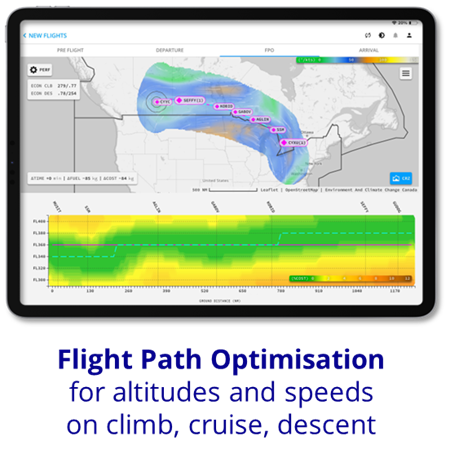
Figure 3.2
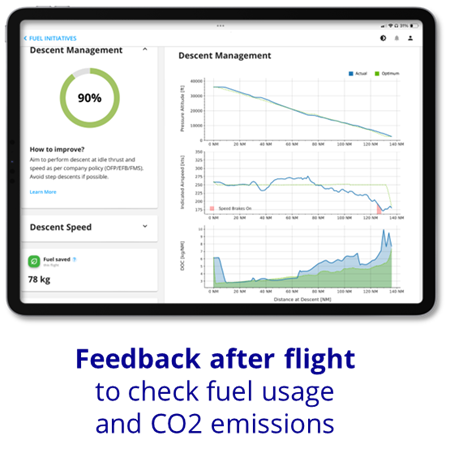
Figure 3.3
Preflight provides pilots with information before departure, including historical versus planned routes, fuel statistics, recommended departure and arrival configurations, and taxi-in and taxi-out routes based on live airport data.
Flight Path Optimization provides optimized speed guidance for all flight phases together with vertical recommendations for the most efficient cruise altitude.
Postflight provides performance feedback after landing, including historical flight records and compliance with fuel-efficiency initiatives.
OPERATIONAL PERFORMANCE
In the previous state, Wizz Air, like many other airlines, relied on the FMS calculations, including speeds and altitudes. While iFMS remains a highly capable and essential flight-deck system, it was not designed to perform the kind of dynamic, data-rich, whole-flight optimization that is now possible with machine-trained solutions and higher-resolution weather and performance inputs.
The FMS calculates the route by propagating data from one waypoint to the next, which can limit how fully changing weather conditions and aircraft-specific performance characteristics are reflected in optimization. In addition, the FMS relies on simplified generic performance models. Compared with the richer performance models used in flight planning systems, these represent only a fraction of the aircraft’s actual performance characteristics and require multiple computational approximations. For example, climb and descent speeds are represented through polynomial functions.
The system also offers limited feedback and graphical insight for pilots evaluating alternative scenarios. Identifying the most efficient configuration would require testing multiple values manually within the FMS. In practice, econ climb and descent speeds are calculated independently and then combined with the cruise phase based on the initial cruise level and top of descent, rather than optimizing the flight as one connected profile.
Wizz Air had already achieved very high compliance with optimal FMS speeds and altitudes, exceeding 90%. However, further savings were becoming increasingly difficult to unlock. At that point, the airline identified the need for a more advanced solution that could provide pilots with better speed and altitude targets than legacy FMS logic alone.
Wizz Air therefore implemented FlyGuide FPO, which:
- Uses tail-specific performance models, so each aircraft receives its own optimal speed guidance.
- Uses high-accuracy weather data interpolated over both distance and time.
- Identifies the true optimum by minimizing Direct Operating Cost (DOC), considering both fuel and time with the cost index as a baseline.
- Optimizes the entire flight profile holistically rather than treating climb, cruise, and descent independently.
- Explains the reasoning behind each recommendation, both in flight and after the flight.
TAIL-SPECIFIC FLIGHT PATH OPTIMIZATION
To overcome the limitations of generic optimization, FlyGuide FPO identifies the true optimum by running multiple simulations for specific flight conditions across different calibrated air speeds and selecting the configuration with the lowest DOC – see figures 4.1 and 4.2.
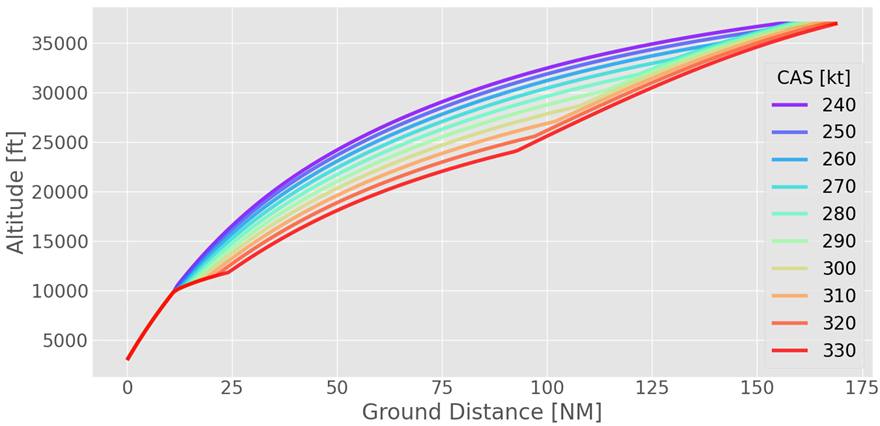
Figure 4.1
Generic performance models represent expected aircraft behavior, but every aircraft deteriorates differently over time and develops its own performance characteristics. Performance factors can correct some deviations, but they do not capture non-linear effects. For that, tail-specific performance modelling is required.
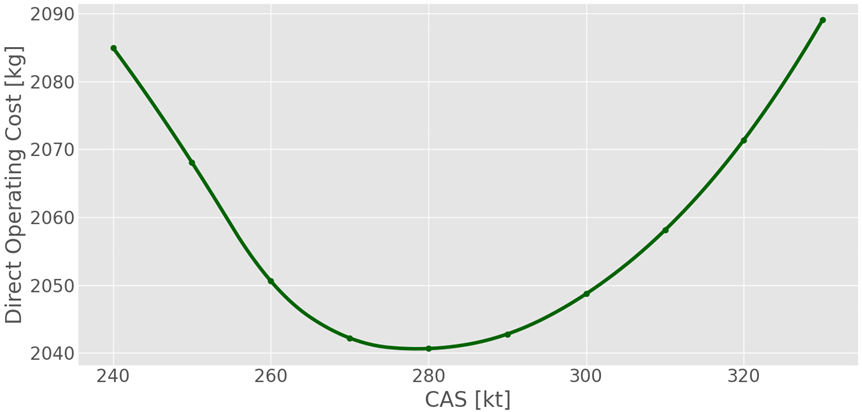
The objective is to identify the speed that minimizes DOC. The chart below illustrates
Figure 4.2
Generic performance models represent expected aircraft behavior, but every aircraft deteriorates differently over time and develops its own performance characteristics. Performance factors can correct some deviations, but they do not capture non-linear effects. For that, tail-specific performance modelling is required.
The objective is to identify the speed that minimizes DOC. The chart below illustrates why tail-specific models outperform the generic models provided by the manufacturer. The magenta line represents the generic model, which shows the lowest DOC at Mach 0.735. The tail-specific model produces a different curve rather than a simple horizontal or vertical shift, and in this example the minimum DOC occurs at Mach 0.755. Under these conditions, using the generic model creates a DOC penalty of 0.51%. With a cost index of 0, that penalty translates directly into additional fuel burn of approximately 0.5%.
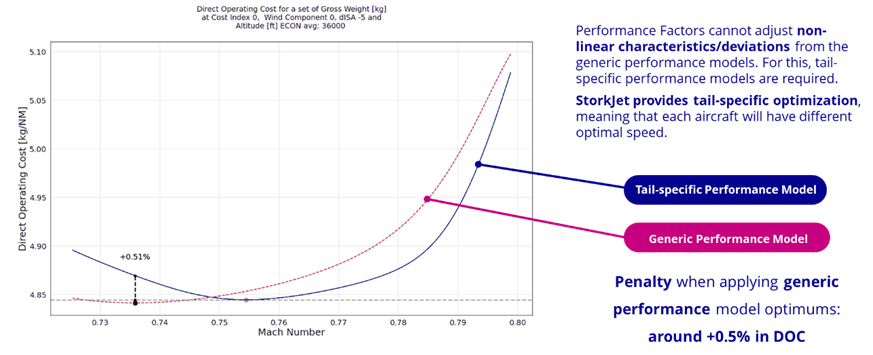
Figure 5
The figure below presents the main application view and its components.
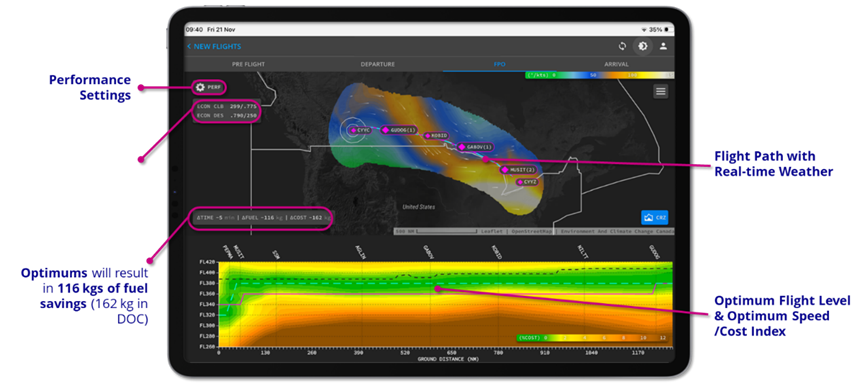
Figure 6
IMPLEMENTATION RESULTS
The example below shows how FlyGuide FPO helps pilots identify the most efficient vertical profile during cruise.
A representative flight from Alicante to Gdańsk illustrates the operational value. The core principle of Flight Path Optimization is to remain within the green area on the optimization chart. These green zones represent the most efficient operating region, while movement toward yellow and brown zones indicates a DOC penalty ranging from 2% to 12%.
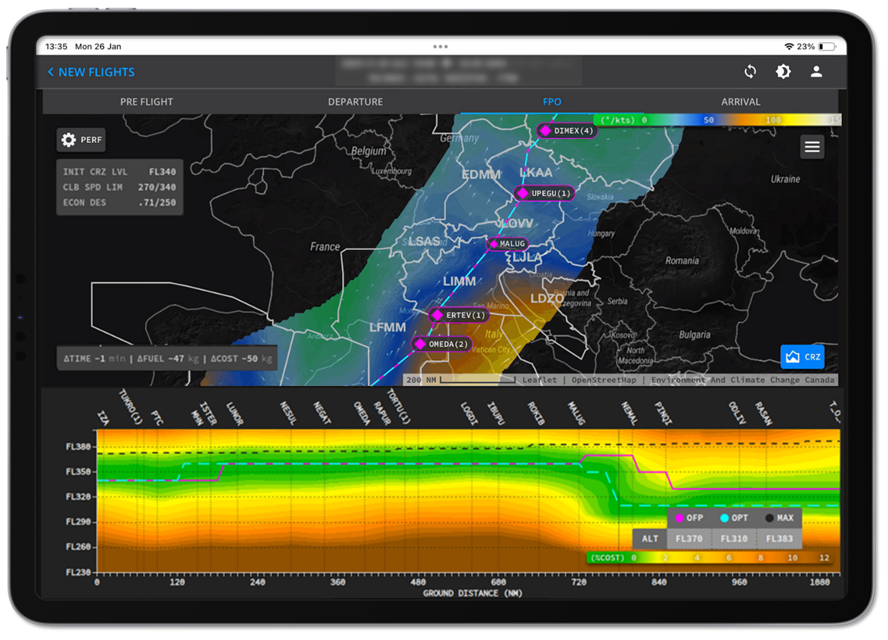
Figure 7
In this example, around 800 nautical miles into the route, FlyGuide FPO recommended a step descent. While the Operational Flight Plan (OFP) also indicated a descent, the recommendation was less pronounced: the OFP suggested FL330, while FlyGuide FPO recommended FL310.
According to the optimization map, part of the OFP-planned route would have entered the yellow zone, indicating a fuel penalty. The lower chart shows that both altitude and speed should be reduced to remain in the optimal region.
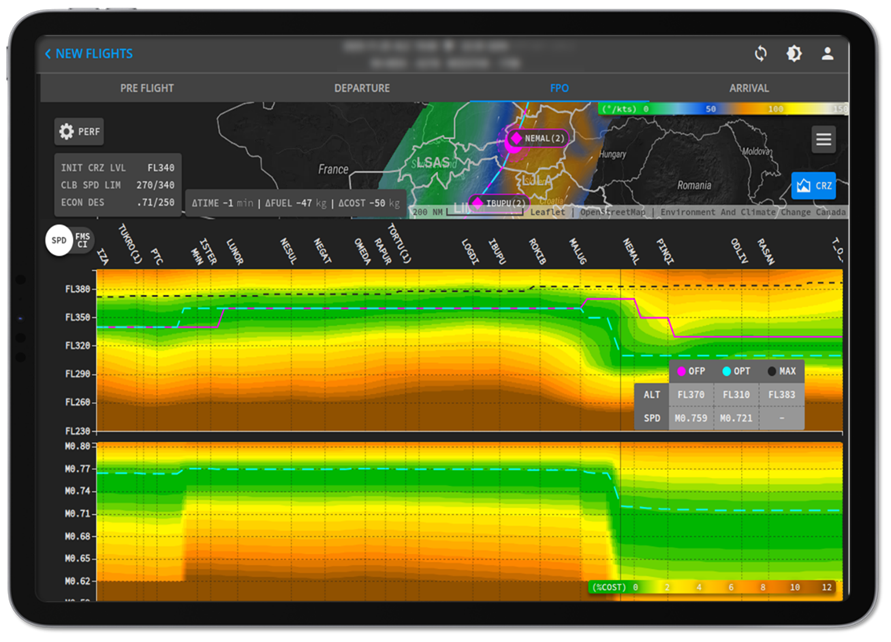
Figure 8
This recommendation was driven by the vertical wind profile. A significant tailwind of more than 70 kt was present at lower altitudes, making an earlier descent combined with a lower cruise speed more fuel-efficient.
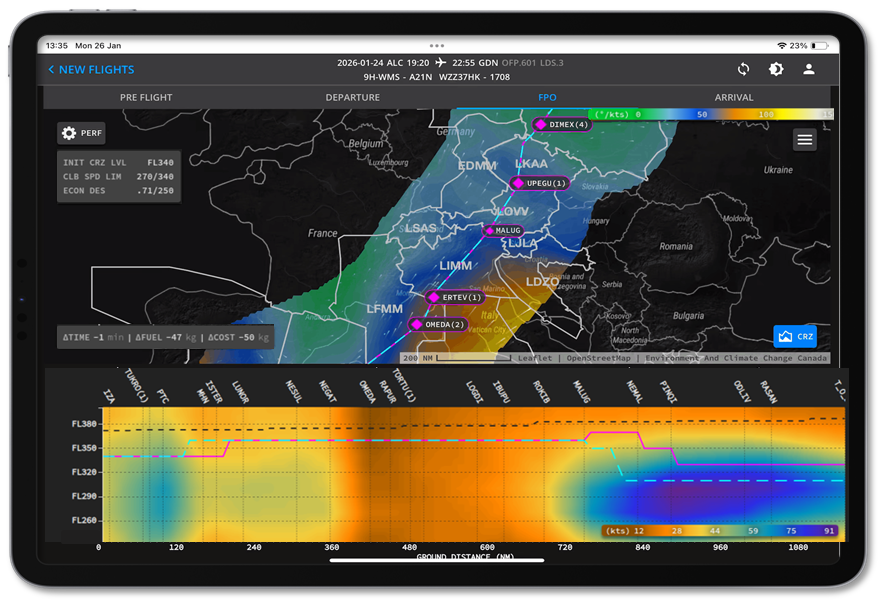
Figure 9
For Wizz Air, it was important that pilots clearly understood the reason behind any deviation from the OFP. If ATC did not approve the step descent, the crew could remain at the OFP flight level. Even if the saving could not be realized, pilots still understood the operational logic behind the recommendation.
Post-flight analysis showed that this flight followed the FPO recommendations exactly. The full vertical profile from take-off to touchdown included a step descent at approximately 800 nautical miles into the route, from FL360 to FL310. The chart below also shows the increase in tailwind to around 70 knots, as predicted by the weather forecast. 100% compliance with FPO resulted in savings of 1 minute of flight time, 47 kg of fuel, and 50 kg of DOC.
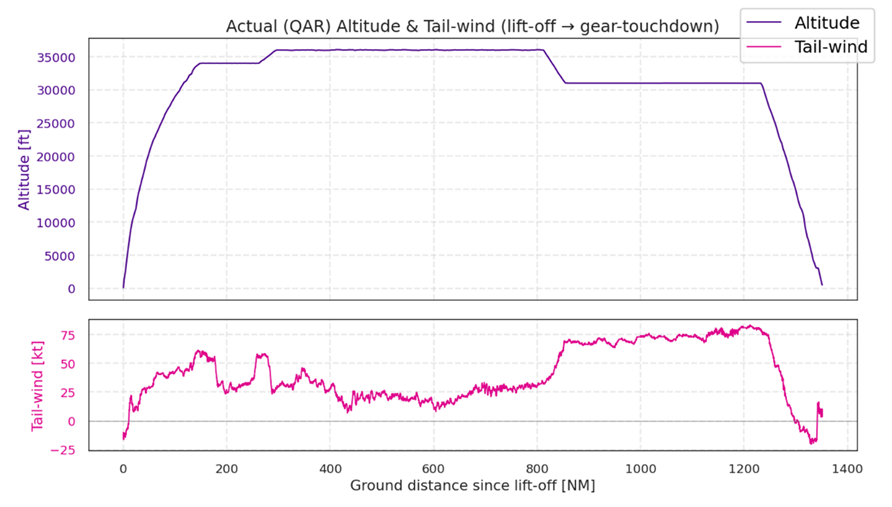
Figure 10
PILOT ADOPTION AND FEEDBACK
During the trial phase, Wizz Air optimized more than 10,000 flights using FlyGuide FPO. Following the business-case analysis, the airline also surveyed pilots to assess usability and operational value.
More than 75% of pilots[1] agreed that FlyGuide FPO provides useful data and information, with more than 22% strongly agreeing. The survey results provided further validation of the tool’s value in day-to-day operations.
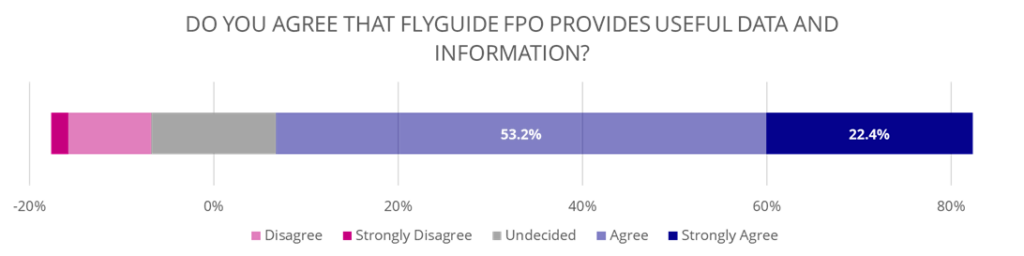
Figure 11
After the full airline-wide rollout, usage statistics showed that 92% of pilots use FlyGuide regularly:
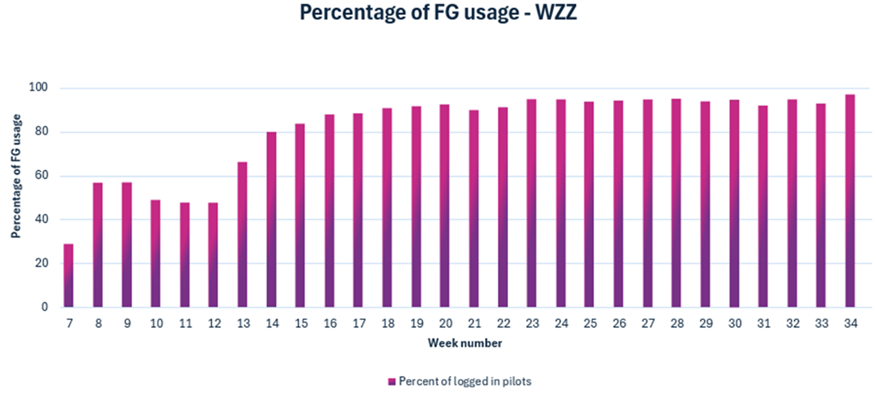
Figure 12
SAVINGS ANALYSIS
To validate the savings, StorkJet analyzed flights flown with FlyGuide FPO recommendations through Digital Twin modelling and compared them with estimated flight costs under standard FMS speeds and altitudes.
Average DOC reduction was 15 kg per flight. In some cases, the savings were significantly higher, while in others no measurable savings were observed. This variation is expected, as savings depend on a large number of operational and environmental variables.
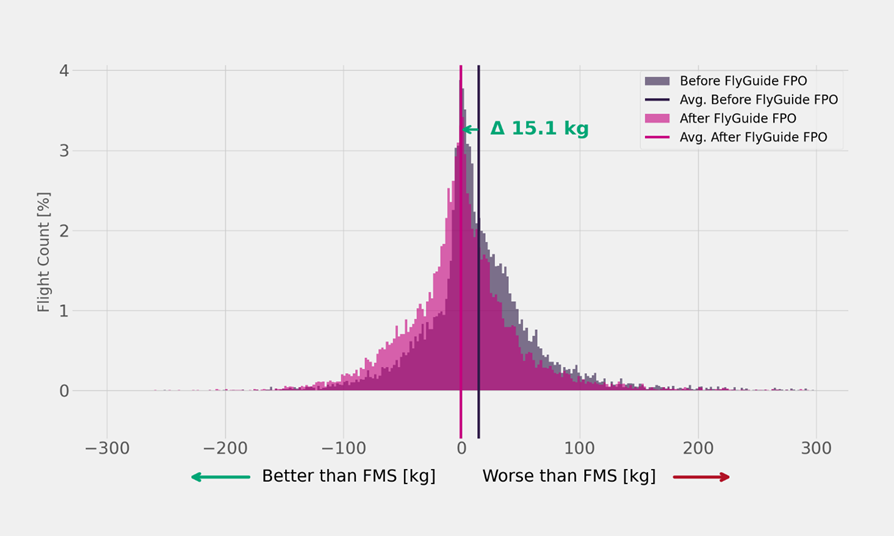
Figure 13
FlyGuide FPO enabled Wizz Air to unlock savings that were no longer achievable through FMS profile compliance alone.
Total annual expected savings from FlyGuide FPO usage at Wizz Air amount to approximately 3,140 tonnes of fuel. At current jet fuel market prices[i], this would correspond to roughly € 3.9 or $ 4.6 million in fuel-cost savings, although actual realized savings depend on fuel purchasing conditions and hedging. The figure is an extrapolation of trial results to a full year of operations.
Figure 14
CONCLUSION
This case study shows that advanced flight path optimization can deliver meaningful additional efficiency gains even for airlines already operating with very high levels of FMS compliance and with other fuel-efficiency measures already in place, including initiatives delivered in partnership with the same provider. By combining tail-specific performance modelling, accurate weather data, and clear pilot guidance, FlyGuide FPO helped Wizz Air move beyond the limits of traditional FMS logic and achieve measurable operational and environmental benefits at scale.
____________________
Reference note
[1] Market data as of April 2026
[1] Survey answered by 143 pilots out of 576 who were given access to the application during the trial period.
Comments (0)
There are currently no comments about this article.
To post a comment, please login or subscribe.