Articles
| Name | Author |
|---|
Case Study: Using Big Data to drive efficiency at Volotea
Author: Jordi Garcia, Operations Engineering Analyst A319, Volotea
Subscribe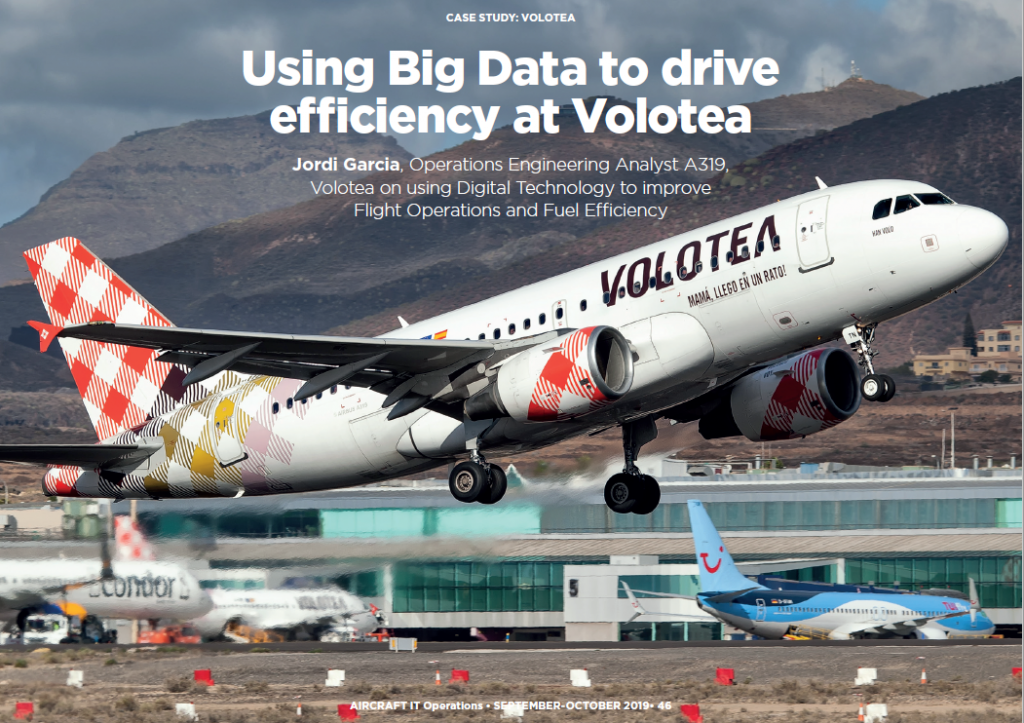
Jordi Garcia, Operations Engineering Analyst A319, Volotea on using Digital Technology to improve Flight Operations and Fuel Efficiency
In this article, I want to share some thoughts on fuel efficiency, including the very important matter of communications; a matter that is sometimes overlooked when we just focus on analyses, big data and continual improvements. What we often forget is how to communicate all that data with meaning to the right people in order to realize changes in the business. But, before we delve in to main topic, I’d like to tell you something about Volotea, the airline to which all this will apply.
ABOUT VOLOTEA
Volotea is a low cost carrier based in Barcelona and connecting small cities mainly in France, Italy, Greece and Spain. The fleet currently includes two aircraft types, Boeing 717 and Airbus A319. I joined the business in summer 2016 and, although I started working with Operations in general, that has shifted to a focus on fuel efficiency which has been my main work since 2017, developing improved reporting and new ways to measure the implementation of our fuel management initiative.
GENERAL CONCEPTS OF FUEL EFFICIENCY
What is efficiency – the concept
If we think about efficiency, we are thinking about physics: efficiency is the ratio between useful work and the energy required to do that work. But sometimes it’s difficult to measure the results from an investment and sometimes it’s difficult to measure the amount of energy that has been invested to get a result. However, what happens when we want to talk about efficiency in aviation? There are so many variables that we don’t control and there are so many ways to do the same things plus we have a lot of difficulties defining and refining a proper way to analyze efficiency:
- Type of aircraft – depending on the type of aircraft used we can be more or less efficient on the same mission;
- Flight management and flight profile – depending on the profile used we will burn more or less fuel but we have to consider all the costs;
- Type of mission – this will contribute to fuel efficiency during a flight.
The upshot is a complex environment to define, hence the difficulties to define what is efficiency
It can be summarized as ‘a way to operate an aircraft, to complete the mission, getting the maximum profitability’, taking into account the conditions that we have, i.e. it might not be the best aircraft, it might not be the best ATC route… but at the end, with a definition, we can do our best to generate the maximum profit or, at least, to burn less fuel and to minimize the additional costs, and that supports the operation.
Don’t get lost in drivers
If we’ve defined efficiency for our purposes in our working environment, how can we measure that? Well, we know that there are cost drivers which are the tools that we have to measure efficiency (figure 1).
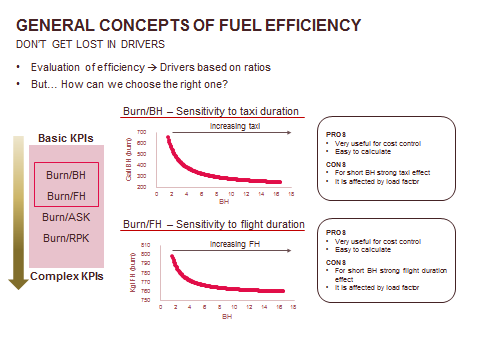
Figure 1
When we talk about fuel efficiency, we can talk about the drivers based on ratios similar to when we were talking about the ratio between useful work and energy required to complete the work. There are two types of drivers to consider to measure efficiency. Basic drivers that are mainly used for cost control purposes and advanced drivers or complex drivers that can deliver more meaningful numbers that allow us to work in depth on our efficiency.
Looking at basic drivers like the burn per block hour (Burn/BH), we see these drivers are useful for cost control because companies usually allocate their costs per block hour and per flight hour (FH) per flight. These drivers are very useful for finance reporting. However, for example, for burn per flight hour (Burn/FH), taxi duration of very short flights can have a very big effect. And, we can arrive at wrong conclusions concerning efficiency. For example, for a one-hour flight, there might be a taxi time of 20 minutes or 40 minutes, depending on time of day. The flight that had a taxi time of 40 minutes will exhibit a lower burn per block hour than the one where the taxi time is 20 minutes. But which flight is more efficient? Obviously, it’s the flight that had the shorter taxi because, at the end, what you want is to go from A to B using the minimum total fuel. This is very complex to explain to Finance because they only look at the high-level data.
It is the same with the burn per flight hour (Burn/FH) but, in this case, it’s affected by the flight direction. If a flight is rerouted because there is a storm, an airspace closure or any other reason, it will exhibit a better fuel consumption per hour than the flight that flew directly from A to B. Again, this can lead us to a wrong conclusion that it was performing better.
To avoid this sort of error, we have complex KPIs (figure 2).
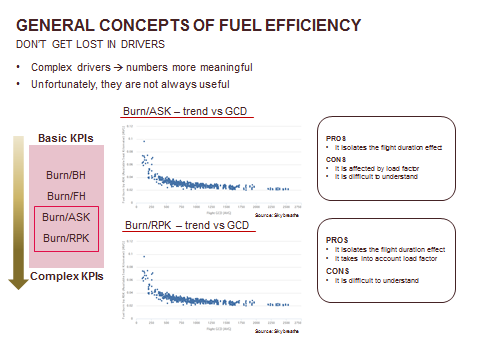
Figure 2
We can think about the most typical drivers in the industry which are burn per available seat kilometer (Burn/ASK) or burn per revenue passenger kilometer (Burn/RPK) and how they behave against, for example Great Circle distance. It can be seen that there is a clear trend that short flights are less efficient than long flights. But for every single distance that can represent a city pair or maybe different city pairs that cover the same stage length several points can be seen. That’s because there are different levels of efficiency for the same type of operation.
At this point, we realized that these kinds of drivers are useful to compare the efficiency of our operation because it takes into account all the things that affect our total consumption covering a distance. With these drivers, we can compare our efficiency for different types of airplane or maybe different routes that cover the same distance.
Who is involved in fuel efficiency?
Once we have this picture of how to measure the efficiency, we’ll need to consider who is involved with efficiency (figure 3).
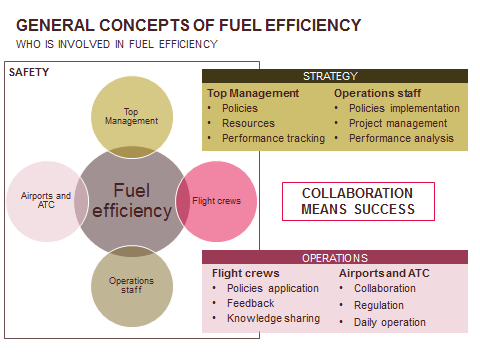
Figure 3
A fuel efficiency program is very complex. We have to take into account that we have different actors that do not always have the same technical knowledge. And when we talk about efficiency, we have to think about safety because our first requirement in the company is ‘Safety First’, as with everyone in the industry: any fuel efficiency program has to be under the supervision of the safety department.
There are two axes inside the fuel efficiency program. One is the vertical axis that takes into account top management and Operations staff and we can think of that as the strategic line. They work to define policies, target resources, track the performance of projects and implement projects; the strategic and tactical part of the project. Then there is the horizontal axis that covers the operation; flight crews, airports and ATC, the people who are affecting our real efficiency in the operation. Flight crews apply policies, give feedback and share their knowledge while the airports and ATC collaborate with the airline, create new regulations that help us to improve our efficiency and regulate the daily operation.
COMMUNICATION
To have a successful fuel efficiency program, there needs to be collaboration which cannot be achieved without effective communication (figure 4).
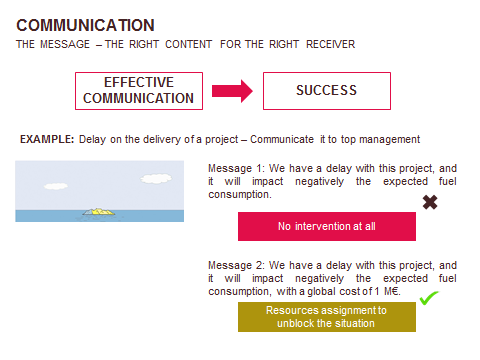
Figure 4
The message – the right content for the right receiver
If we communicate in a proper way, we will transmit the right message to the right receiver and, at the end, there will be a change in our company or in our operation or in an individual’s behavior.
For example, a problem with a project, let’s say ‘engine wash’, can have a big impact on the operation. What if we try to communicate this idea with just a flat sentence; ‘Oh, we have a delay, we won’t get the savings that we have targeted’. We are revealing just a small part of the problem and management will not have enough information to evaluate the situation. So, at the end, there won’t be any intervention because they don’t know the real effect of this problem. If, instead of doing that, we give them information to evaluate the project, perhaps by adding to our communication ‘… and it will cost €1m’, they will see the whole picture and, probably, if it’s important for them, will allocate resources. It’s very important that we send the right message to the right receiver. It’s not the same talking to management as talking to flight crews, it’s necessary to tailor the way a message is expressed to the level of knowledge and the level of implication in the project. In the end, we need to transmit important material with the message. This is a most important concept of communication.
Volotea’s reporting philosophy; how do we do it?
We realized that we needed to communicate in a very proper way so we developed a very strong reporting policy. This policy is divided into two methods, depending on the receiver; one based on strategy and one based on operation (figure 5.1).
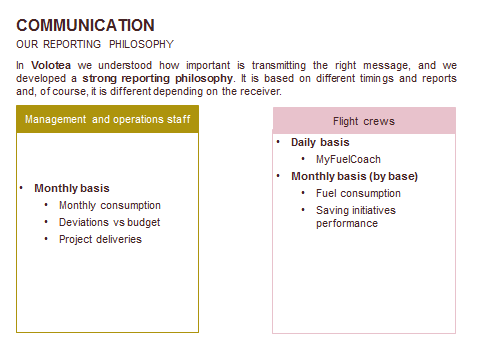
Figure 5.1
For strategy, we send the communication to management and operations reporting on fuel consumption for operations control and cost control; plus, there is a monthly more detailed analysis which (figures 5.2 and 5.3) showing deviation, tracking consumption, updating on the project…
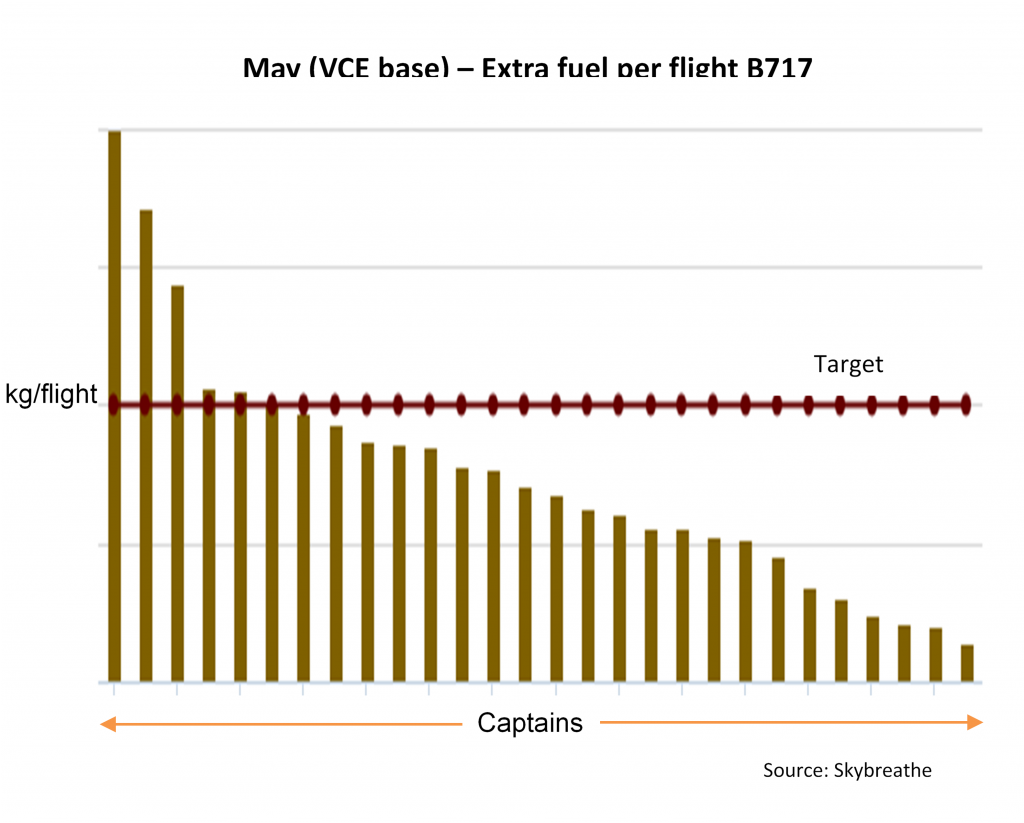
Figure 5.2
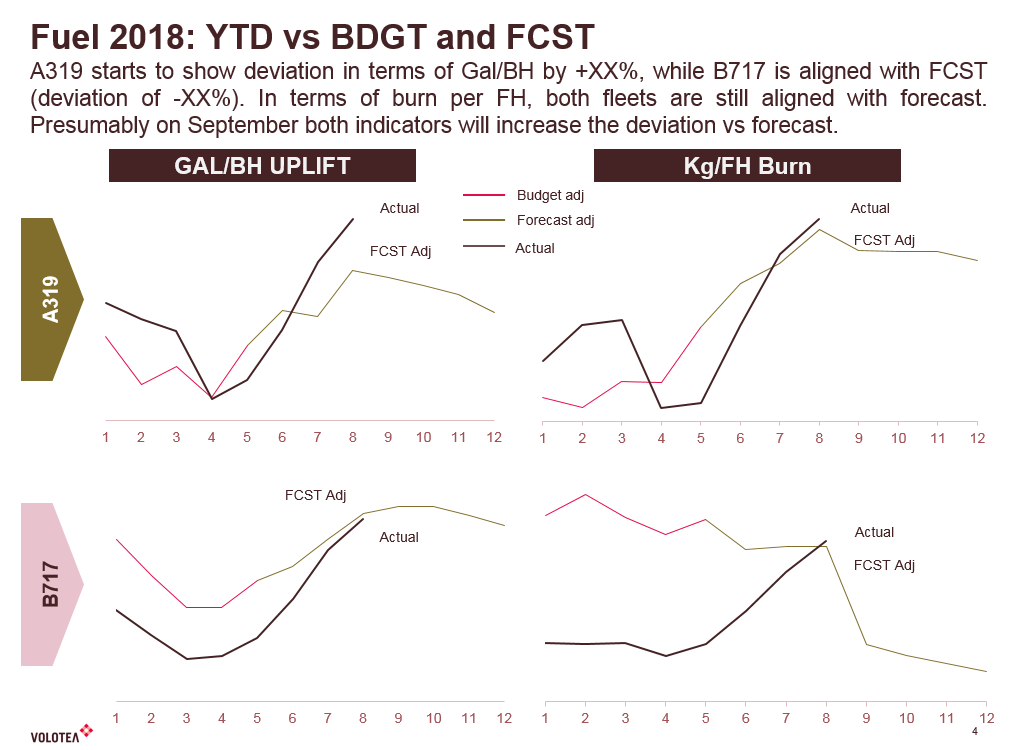
Figure 5.3
… then, at the end of the year, we summarize all the operations that we have, how was fuel consumption against what we expected, why actual was better or worse than expected, how are other projects and what are we delivering from them, can we improve them? For example, here we have a monthly report showing the trend against the budget because, at the end, what controls our operation is the budget. It’s very important to have the real picture of where we are against where we expected we would be.
For flight crews, and operations, we have, again, daily reporting based on the MyFuelCoach App for pilots provided by Skybreathe – more below. It’s a monthly report that gives a picture of every operating base of the company which is sent to the Chief Pilot who decides how to work with this data. And, finally there is an annual report, not at the same level as the top management report but giving a big picture of what has happened during the year. Here there are different metrics that we provide to our pilots with their burn per flight hour, for example, or the extra fuel that we have used against target and, below target. Our captains feel comfortable with the plan and they understand that we are providing the tools they need. This is on a monthly and an annual basis and only the pilot knows which Captain he is and it’s not shareable, to protect their privacy because we don’t want to punish them, we want to help them.
MYFUELCOACH – OUR EXPERIENCE
Advantages of using it
MyFuelCoach is a tablet or iPad based App that Volotea has adopted for pilots. In the App, we have a lot of data about their flights so that every pilot can access and interrogate his own flight history, how was the flight, what was his performance and his mileage against the company average.
User experience has been good with pilots able to access their flights (individually and in summary) and they find the App easy to navigate. They feel comfortable using the App and understand what they see. Data is integrated to the system once it has been uploaded to the server and any comparisons are anonymous inasmuch as only the pilot can see their own flights and the system offers them a very detailed report of the flight with matrices that can help to analyze their performances for them to use for self-improvement. There are a lot of matrices and these are clear and offer good definition. Results are normalized against the company performance which all adds to the tools available for pilots. There are also detailed trajectories and other information relating to performance: it’s all in the App.
Typical interest
When we provided the solution, different users had different interests and within a few months of using the App, we found more or less always the same feedback. People asked how we got the data and how we could be presenting this level of detail. It was because we had integrated a number of different data sources; the software had put it all together and delivered a final result that is a clear analysis, once they understood where the data comes from, they then asked whether the data was public, can anyone else see it? We explained that it was anonymous, only the pilot himself can see his own data. It is essential that pilots are happy to have this App because it’s not designed to punish anyone but rather for them to use for self-improvement. Finally, when all that was understood, they agreed that, yes, they liked the data and found that they could find opportunities for improvement.
We started to see variances from the company averages and people asked if we were sure that the numbers were right. Behind the App is a large data analysis with a lot of filters, comparisons and normalization, so that data can be trusted to be accurate. With that assurance, pilots began to understand where they were not doing as well as they thought. Finally, they asked, ‘how can we improve, we want to be the top of the company.’ This is the great value of this kind of communication – give people the tools to evaluate the situation and, at the end, they will develop their own route to improvement.
Feedback from pilot community
We valued the feedback that users gave us and three typical feedbacks that we received were:
- From a pilot – ‘Having all the information in just one source is the best thing because we can analyze in detail anything that we want.’
- Another pilot said that – ‘The information is relevant and precise.’
- Yet another said – ‘OK, this is very easy to use and is very helpful to improve the efficiency of the company.’
We are happy with these responses; our pilots are happy with the system and, thanks to these kinds of tools, we have our data available in a useful level of detail.
Evolution of some KPIs since we started using it
Now, I’d like to share with readers some results from Volotea after we started using the App. We implemented the App in 2016 and at the beginning we were learning how to use it. During 2017 and 2018 we started to get more value from the App (figure 6).
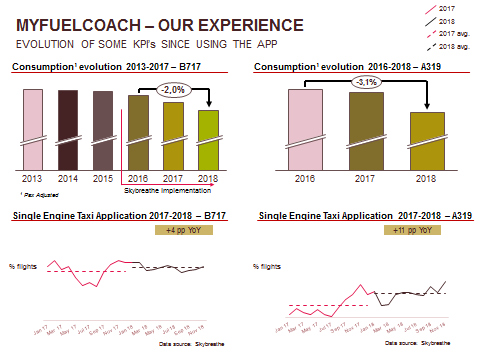
Figure 6
We could see that fuel consumption had gone down by 2% for the Boeing 717 fleet and by 3.1% for the Airbus A319 fleet. This is a very good result from my point of view as I deal with fuel efficiency every day. But, beyond those global results, we are able to focus on specific practices that help us to improve fuel efficiency. For instance, using Single Engine Taxi contributed to fuel efficiency improvements for both fleets of 4 pp (percentile points) for the B717s and 11 pp for the A319s. The general trend has been very positive after the pilots started to receive feedback about their performance.
There are other useful metrics (figure 7).
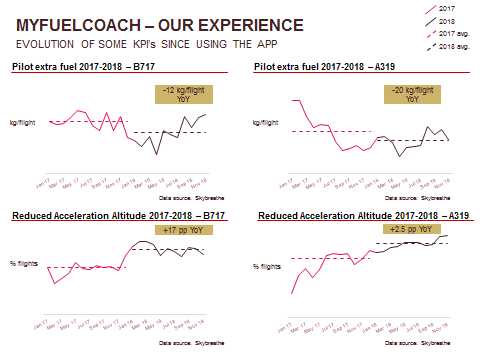
Figure 7
For instance, with ‘Pilot extra fuel’ we saw that, after giving pilots the analysis of flights, they started to better trust the operational flight plan (OFP) because they were able to see that there would be enough fuel to fly their mission. In the end, the meant that, on average, we were carrying 12 less kilos per flight for the B717s and 20 less kilos per flight for the A319s. This was good because it reduced extra weight, which had not been generating any revenue, and further reduced fuel burn.
Finally, looking at the Reduced Acceleration Altitude; pilots have to focus on this during their climb phase but they sometimes do not realize the importance of the practice. However, thanks to the proper communication and giving them the tools to understand it, we found that, for the B717 fleet there was a large improvement of 17 pp while the A319 fleet saw an improvement of 2.4 pp.
We have seen that globally we are improving thanks to the strong reporting philosophy and thanks to proper communication. We now have an overall picture of the topic and a clearer idea of communication. We want the company’s message to be communicated properly and to get the right message to the right receiver.
Contributor’s Details
Jordi Garcia

In over two years at Volotea, Jordi has worked in operations engineering, including performance analysis, weight and balance, route analysis and airport studies. During the last year his special focus has been on fuel efficiency, working to define a new way to understand fuel efficiency in the company, involving pilots in the development of new initiatives and ways to optimize operation without compromising safety.
Volotea

Volotea is a Spanish low-cost airline with almost 300 routes and plans for this to grow to 500-600. As of June 2018, the airline had carried 18 million passengers since launch in 2012. The route network serves metropolitan and leisure destinations around the European side of the Mediterranean coast as well as Western and Southern Europe plus seasonal charter flights from London Southend Airport. The fleet consists of 14 Airbus A319-100 and 17 Boeing 717-200 – being phased out.
Open Airlines
OpenAirlines is an international software company based in Toulouse, with offices in Hong Kong, and Miami. The company provides consulting and software solutions for Airlines Flight Operations. Drawing on 8 years of R&D the SkyBreathe® eco-flying software came out in the market in 2013. Based on Big Data algorithms, AI and machine learning, the digital solution reduces airline first cost driver by 2 to 5% without any modification to their fleet while allowing them to become leader in environmental excellence. Rewarded by many innovation awards and today a world leader in the market, the software is now used by a very active community of airlines around the world including Malaysia Airlines, Norwegian, flydubai, Cebu Pacific, Transavia…
Comments (0)
There are currently no comments about this article.
To post a comment, please login or subscribe.