
Articles
| Name | Author |
|---|
CASE STUDY: Saving fuel at Azul with custom flight analytics
Author: Juliana Paes Dos Santos, Fuel Efficiency Coordinator, Azul Brazilian Airlines
SubscribeJuliana Paes Dos Santos, Fuel Efficiency Coordinator, Azul Brazilian Airlines shares how Azul saved 1.5m liters of jet fuel by optimizing ATC and charts at Viracopos Airport
Before we go into the main topic of this case study, I’ll give readers a brief overview of Azul and our operation.
AZUL
As the largest airline in Brazil with more than 700 takeoffs daily and over 150 destinations served, Azul operates a mixed fleet of more than 150 aircraft.
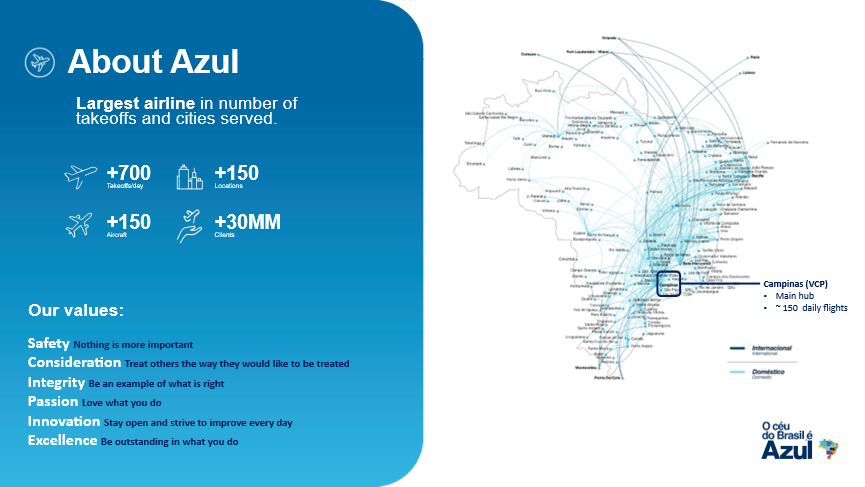
Figure 1
The airline transports more than 30 million customers a year, with about 150 daily flights, to both domestic and international destinations. Our culture is defined by six core values: safety (our priority), consideration, integrity, passion, innovation and excellence. Together, these principles shape how we operate and how we serve our customers across the country. In order to match the right aircraft to the right route and provide an efficient service across Brazil’s varied geography and infrastructure, we operate one of the most diverse and flexible fleets in the world (figure 2).
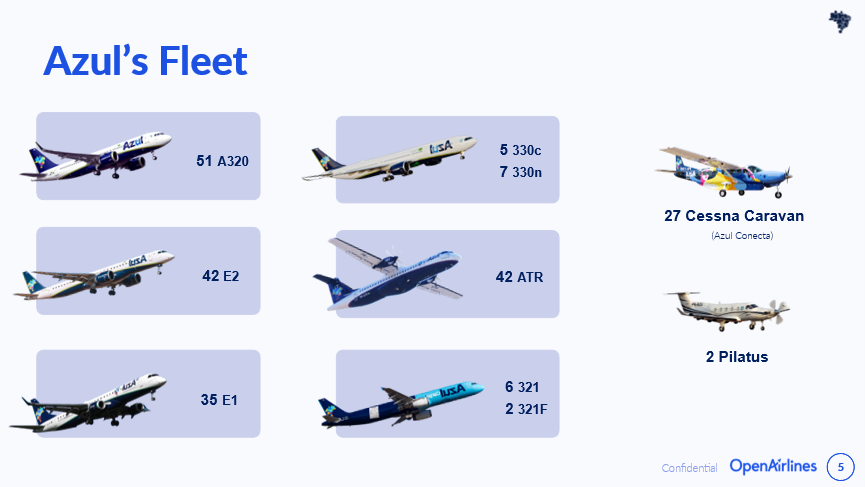
Figure 2
Our fleet includes 51 Airbus A320s, eight A321s and both A330ceo and A330neo models for long-haul operations. On the regional side, we fly a significant number of Embraer aircraft, supporting high-frequency service on medium demand routes. We also operate 42 ATRs for regional connectivity and, through Azul Conecta, we reach smaller and more remote airports with 27 Cessna Caravans. Additionally, we have two Pilatus aircraft and two A321 freighters that support our growing cargo operations. While this combination gives us the flexibility to serve everything from large international hubs to small regional communities, it also adds a lot of complexity to Planning and Operations – that’s why efficiency is fundamental to Azul’s operations.
THE PURPOSE OF THE PROJECT
Because of that complexity and the need for efficiency, we realized that we needed to consider how we could fly better, starting with our main base and hub, São Paulo’s Viracopos-Campinas International Airport – VCP. (figure 3).
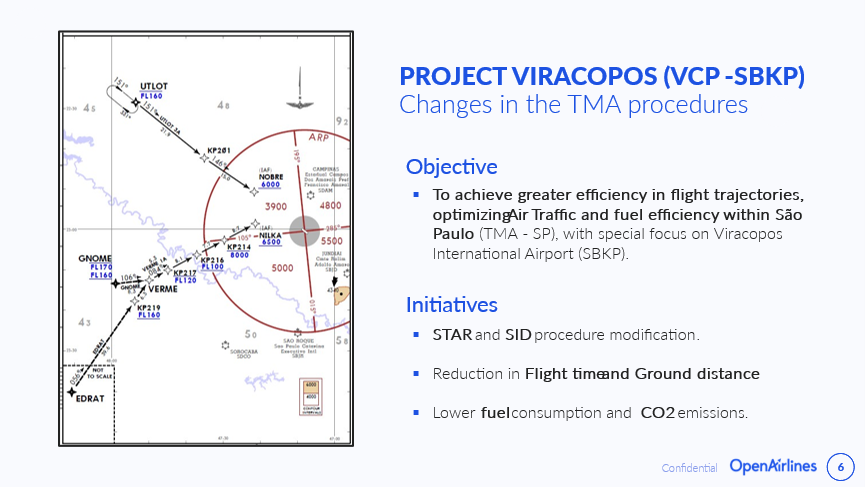
Figure 3
The main objective of the project was to increase efficiency in flight trajectories with a special focus on Viracopos airport. By optimizing how aircraft arrive and depart within the TMA (Terminal Maneuvering Area), we could improve overall air traffic flow and reduce unnecessary track miles. To achieve this, we worked on several key initiatives. The first is modifying the STAR (Standard Terminal Arrival Route) and SID (Standard Instrument Departure) procedures to create more efficient and predictable paths. These improvements result in shorter flight times, reduced ground distance, and ultimately a better operational flow for the airport.
As it’s our main hub, Azul is the main airline that flies to and from Viracopos, but we are looking at improvement for everyone flying there, which supports both our operational performance and our ESG (Environment, Social and Governance) responsibility. Overall, Project Viracopos aimed to create a more efficient, sustainable, and modern approach to traffic management. As we continued with the project, the focus remained on refining procedures that had a direct impact on both traffic efficiency and aircraft operations.
THE INVOLVEMENT OF OPENAIRLINES AND SKYBREATHE®
SkyBreathe® from OpenAirlines played a major role in Project Viracopos and in achieving the results we wanted. Using the platform allows us to analyze real flight reconstruction data in depth, including ATC (Air Traffic Control) clearances, level adherence, planned versus executed trajectories, and actual time and distance flown. With all of this information, we were able to identify inefficiencies, patterns, and opportunities for improvement. In many cases, SkyBreathe® provided the evidence we needed to work collaboratively with ATC authorities and propose procedural changes. A useful element was SkyBreathe® Map (figure 4.1).
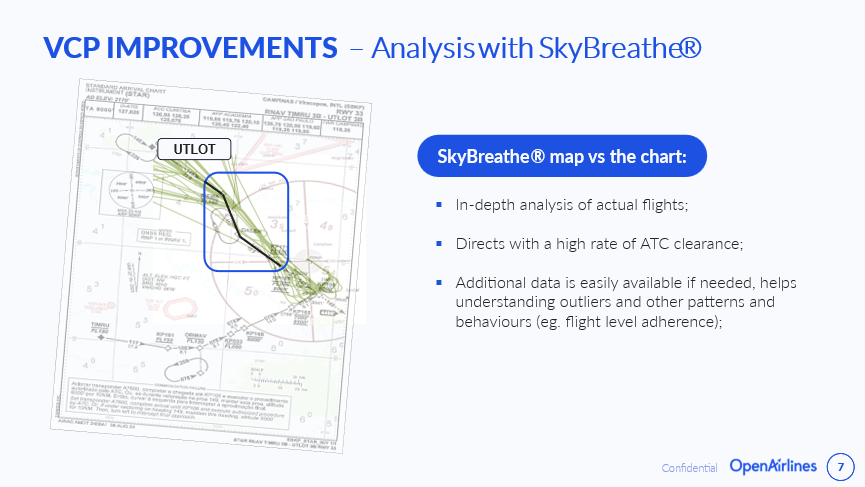
Figure 4.1
With SkyBreathe®‘s map function, we could overlay the actual flight paths on the chart, allowing for a direct comparison with the chart data.. With this, we started to understand much better what actually happened at Viracopos: if I’m really following the chart or if I have a high rate of ATC clearances, which could mean that I should be doing something else. So why not change the charts to match what we were seeing?
The platform allows us to analyze real flight reconstruction data in depth, including the ATC clearances, lateral adherence, plan versus executed trajectories and actual time and distance flow. With all of this information, we were able to identify the patterns, the inefficiencies, and the opportunities for improvement. Again, using this example of plot, you can see that we had such a high rate of clearances that it was as if we were flying a different flight path than we had for the ATC chart. So, I was able to go to the ATC authority and say, ‘why not change the chart to this?’ SkyBreathe® provided the evidence that we needed to really work together with the ATC authorities to approve those changes (figure 4.2).
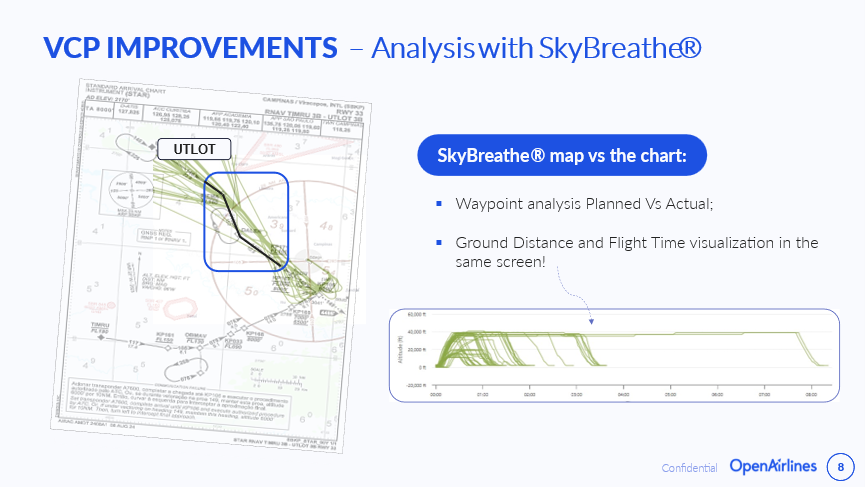
Figure 4.2
Beyond that, SkyBreathe® allows us to visualize both ground distance and flight time on the same screen. This integrated view makes it easier to understand the operational impact of each trajectory change and quantify the benefits in terms of fuel savings and emissions reduction. Having the full picture was fundamental for discussions with DECEA (Department of Airspace Control – Brazil) and other airlines. It helped to make sure everyone understood not only the impacts, but also the potential we had. With these insights, Project Viracopos could continue to evolve in a data‑driven way, ensuring that procedural changes translated into real operational improvements.
CHANGES IN THE TMA PROCEDURES
UTLOT is a waypoint used in flight routing and Standard Terminal Arrival Routes (STARs) for the São Paulo airspace so next, we’ll look at some of the process we went through to make those modifications and how SkyBreathe® supported us during each step, starting with the UTLOT STAR. In figure 5, you can see the situation we had before the changes.
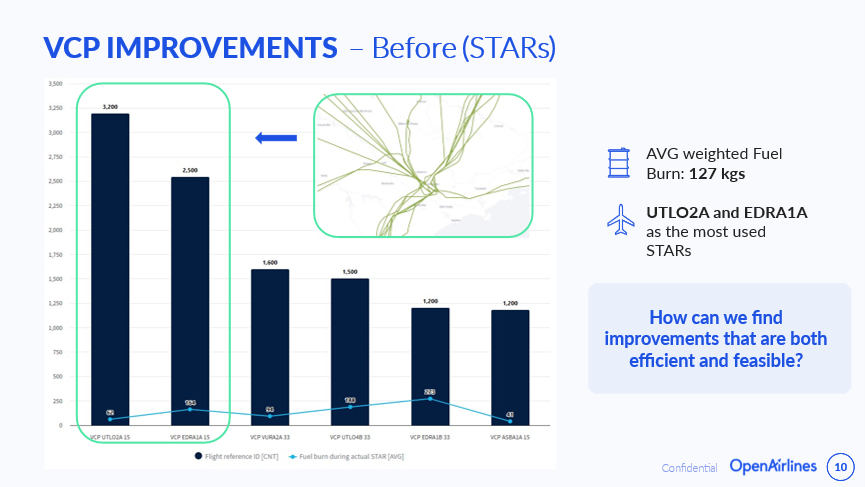
Figure 5
Since Viracopos is our hub and we have a lot of different flights to and from many places in Brazil, there are many different STARs and procedures at the airport. Some of the most used ones, like UTLO2A and EDRA1A, had relatively long paths, with an average fuel consumption of around 127kgs. With that scenario, our main question was: how can we suggest improvements to our air traffic authority that are both feasible and efficient? SkyBreathe® played a major role in answering this question: as I’ve shown above, the platform allowed us to analyze real data in depth, often providing the evidence we needed to work with DECEA.
For the data and analysis that SkyBreathe® provided, and working together with DECEA and our ATC team, we made a lot of changes throughout our charts. Some examples of Old and New charts can be seen in figure 6.
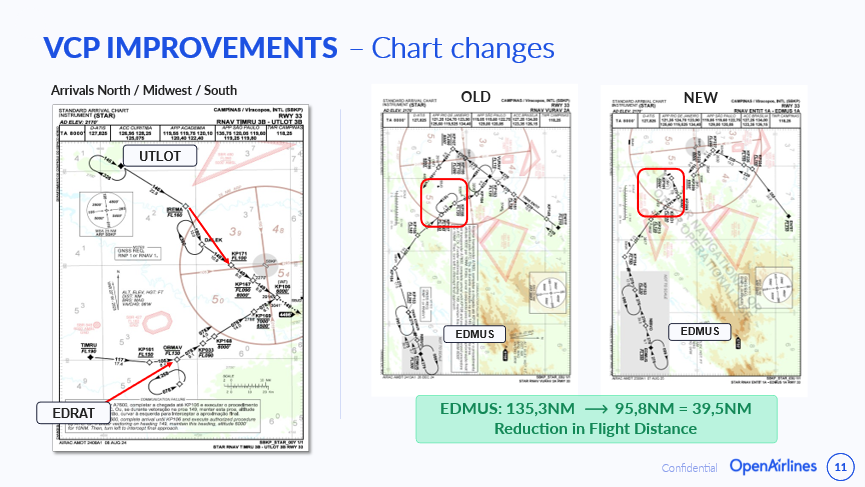
Figure 6
You can see here that unnecessary shoulders were removed from UTLOT and EDRAT and we removed part of the EDMUS STAR, which represents a reduction of almost 40 nautical miles. This is a win not only for Azul, but for everyone flying the TMA. SkyBreathe® played a major role in proving to the authorities that this would not have a negative impact in our operations and would actually make it easier for both pilots and the controller, reducing the need for constant requests and clearance.
AFTER THE IMPROVEMENTS AT VIRACOPOS
Figure 7 shows some of the main improvements that have been realized.
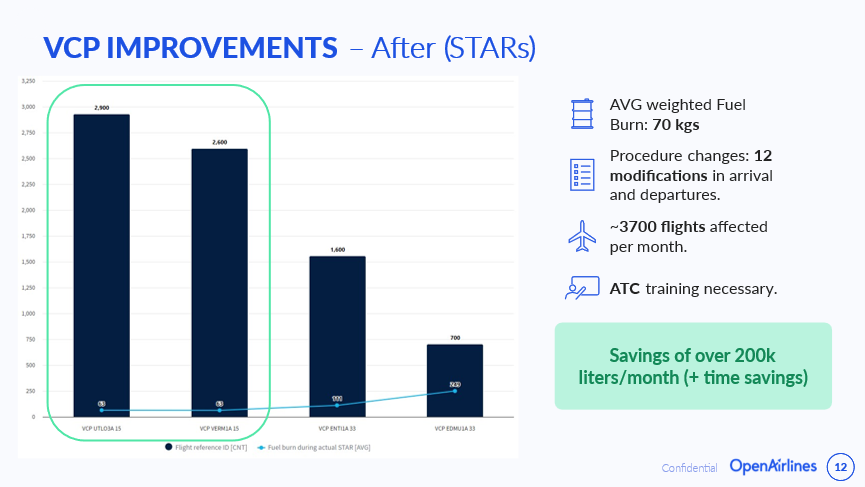
Figure 7
After the redesign, the new average weighted fuel burn was around 70 kilos, which is a drastic reduction from what we had before. To reach this, we made around 12 modifications in total, both in departure and arrival charts. This project was really big; it took a lot of time, and a lot of study. Our dedicated ATC team at Azul works together with the fuel efficiency team to talk to the ATC authorities. Part of our ATC team are pilots, so they have hands-on experience with the procedures. This change required training time, which was done by phases.
The second phase started in August 2025 after DECEA had to retrain their controllers so they would be used to the new routes. Everything was done with safety in mind, so the whole process, from when we started the studies until we had the final charts published, took around one and a half year. But now those changes affect around 3,700 flights every month, generating fuel savings of over 200,000 liters. This is a huge improvement, not only for the fuel efficiency team but also for the ATC team, and since the paths are shorter now, we also have time savings. Both the on-time performance and network management teams were very happy with that. They noticed that they had a lot more flexibility to work with, especially with some flights that arrived late at VCP.
One of the worries that we had when changing the procedures close to the arrival, between the STARS, was making what came before the arrival worse, since the airspace is really complex, and by changing one thing, we would inevitably have an impact on other procedures.(figure 8).
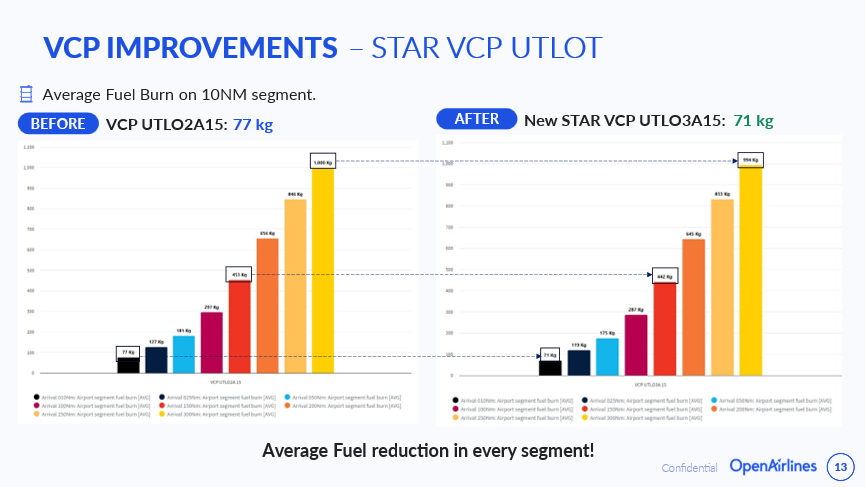
Figure 8
As you can see, this was not the case where it mattered – we had a fuel burn decrease in every single segment for UTLOT, our most used STAR. Again, SkyBreathe® made it much easier to measure and played a major role in every step of the process – before, during and after. If we didn’t have the tool to really understand the process and look into it, we wouldn’t have such a great and complete project.
Another important part of the project was the redesign of ENTIT STAR. In this case, we applied the same methodology as before, but with an analysis improvement – using SkyBreathe® Custom Flight Indicators (figure 9).
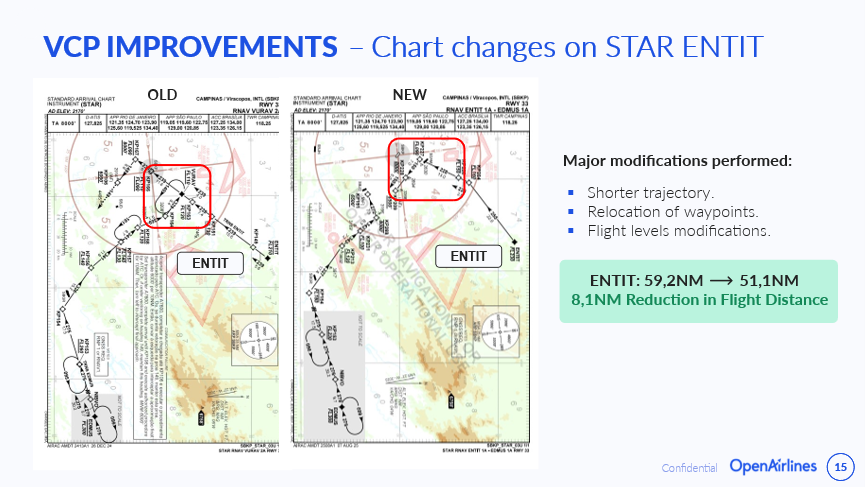
Figure 9
As you can see, for the ENTIT STAR, we had major changes. We relocated waypoints, we had flight level modifications and, overall, created a route that was eight nautical miles shorter when looking at the charts. But we asked ourselves, how can we go further using SkyBreathe®? With Custom Flight Indicators we can compare the procedures during any segment of the descent phase. This is especially useful when you are comparing two similar but different procedures, and this allowed us to validate the changes that we made, as in figure 10.1.
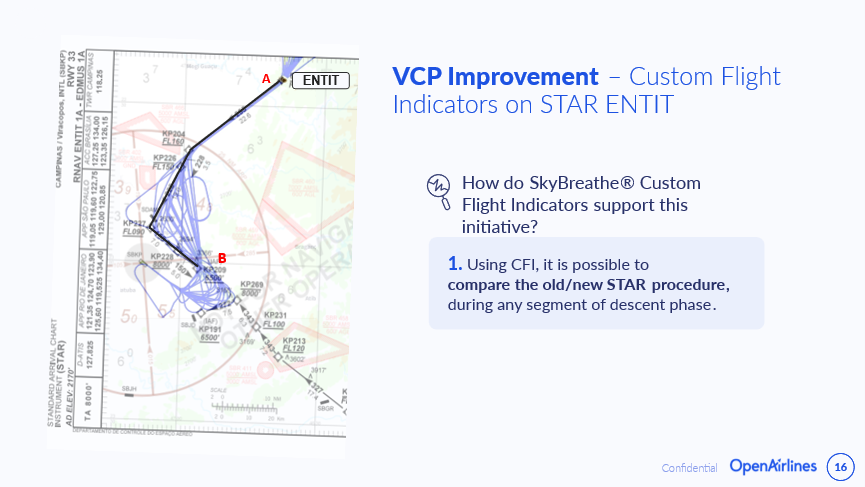
Figure 10.1
This is possible by defining the points of interest and extending the analysis across flight level, fuel burn, flight time and pretty much any variable that we want (figure 10.2).
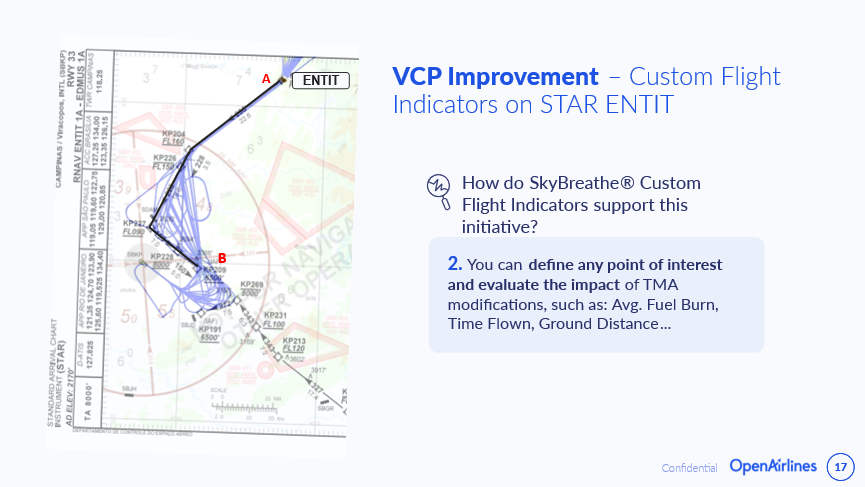
Figure 10.2
The flexibility offered is valuable during the validation because you always have something else that you want to look at when you start doing these kinds of studies. The figures illustrate a pretty straightforward example, which is analyzing a common point of interest between the old and new procedures, like the start of the ENTIT until the beginning of the landing phase (figure 10.3).
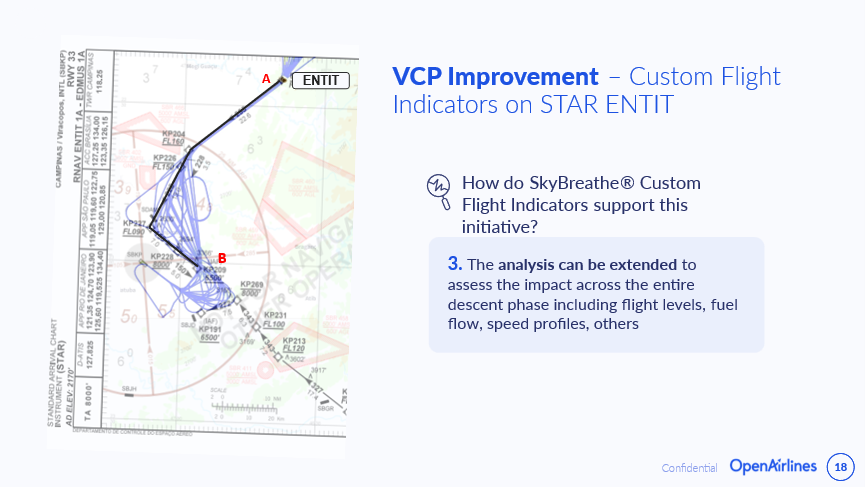
Figure 10.3
As you can see in figure 10.4, using the tool is very easy and very straightforward. All you need to do is define what you want to analyze; that’s pretty much it.
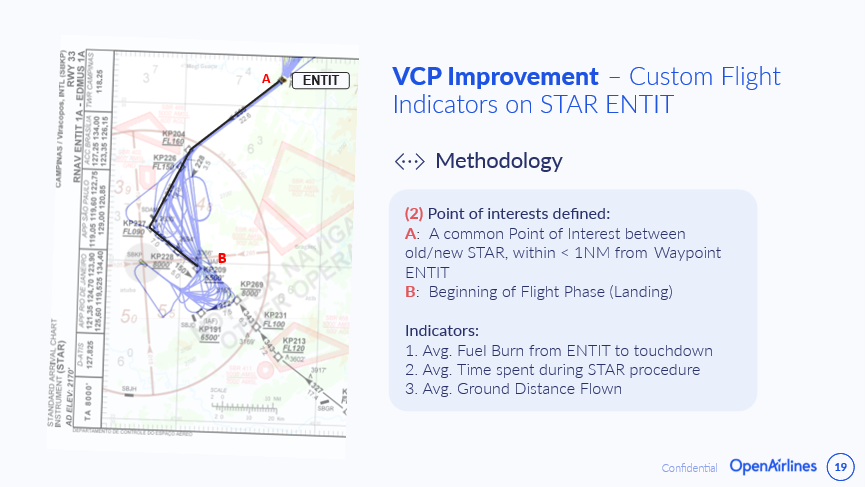
Figure 10.4
RESULTS, IMPROVEMENTS AND OPPORTUNITIES
Thinking about the results, as in figure 11, you can see that the new ENTIT STAR burns almost 32 kgs less than the old one on top of reducing around six nautical miles per operation, plus, is 83 seconds quicker, almost a minute and a half.
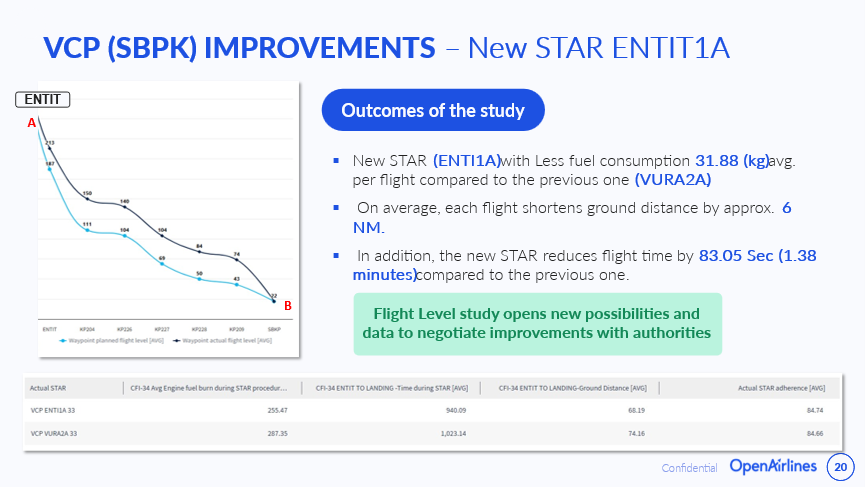
Figure 11
This was only made possible by defining the points of interest, otherwise there would not really be a base line for the comparison because they are not the same thing anymore; they’re similar but they’re different. These numbers might individually seem small, but they apply across around sixteen hundred flights per month – it adds up fast and makes a huge impact in the operation. Additionally, our flight level analysis reveals further opportunities to discuss with DECEA and our ATC team for potential future adjustments. So not only are we seeing the results of our work, but we are also getting new ideas and possibilities of improvement with SkyBreathe®‘s tool. And this is considering the holding and the vectoring, which sometimes can happen more when you make those changes to STARs. The tool helped us with these improvements, but it also helped us analyze what we did, and now it helps us see how we can do even better (figure 12).
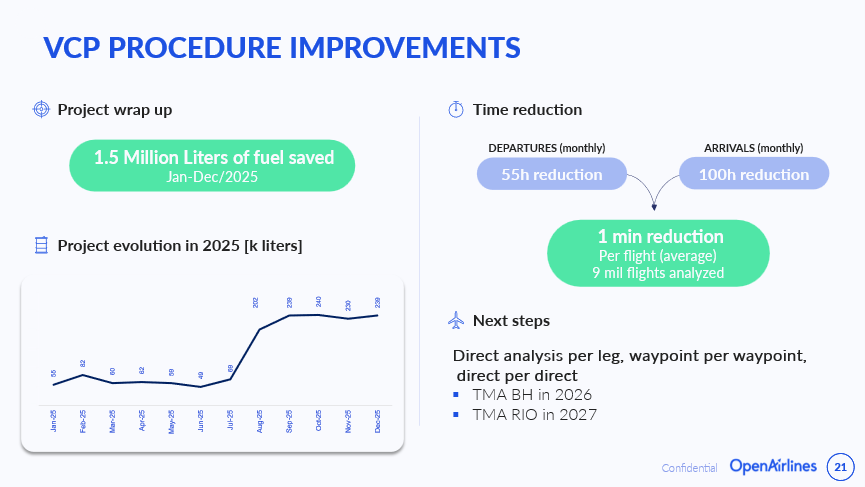
Figure 12
Looking at the global results with this project, in 2025, we had savings of around 1.5 million liters of fuel. As you can see, the savings went up in August when all of the charts were published after ATC training. When we look at the time savings, we had an average of one minute less per operation across nine thousand analyzed flights. This translates to 55 hours less in departure and 100 hours less in arrivals at Viracopos – again, our network and on time performance teams were very happy with that. This is the direct result of more efficient trajectories, something we achieved by working with our dedicated ATC team and SkyBreathe®. As for the next steps, we are working with the tools we have in our fuel efficiency platform and expanding the project to TMA Belo Horizonte this year and TMA Rio de Janeiro in 2027. These will be large projects, but the results we had from Viracopos give us great confidence in the results.
To conclude, these improvements show the impact of combining operational insight, data analysis and close collaboration with our ATC team and Brazilian authorities. The partnership between Azul, SkyBreathe® and DECEA has produced meaningful and measurable advances in efficiency, sustainability and operational performance.
Comments (0)
There are currently no comments about this article.
To post a comment, please login or subscribe.