
Articles
| Name | Author |
|---|
CASE STUDY: Azul models inflight fuel savings
Author: Caio Garcia, Senior Manager – Fuel Efficiency, Azul Linhas Airlines
Subscribe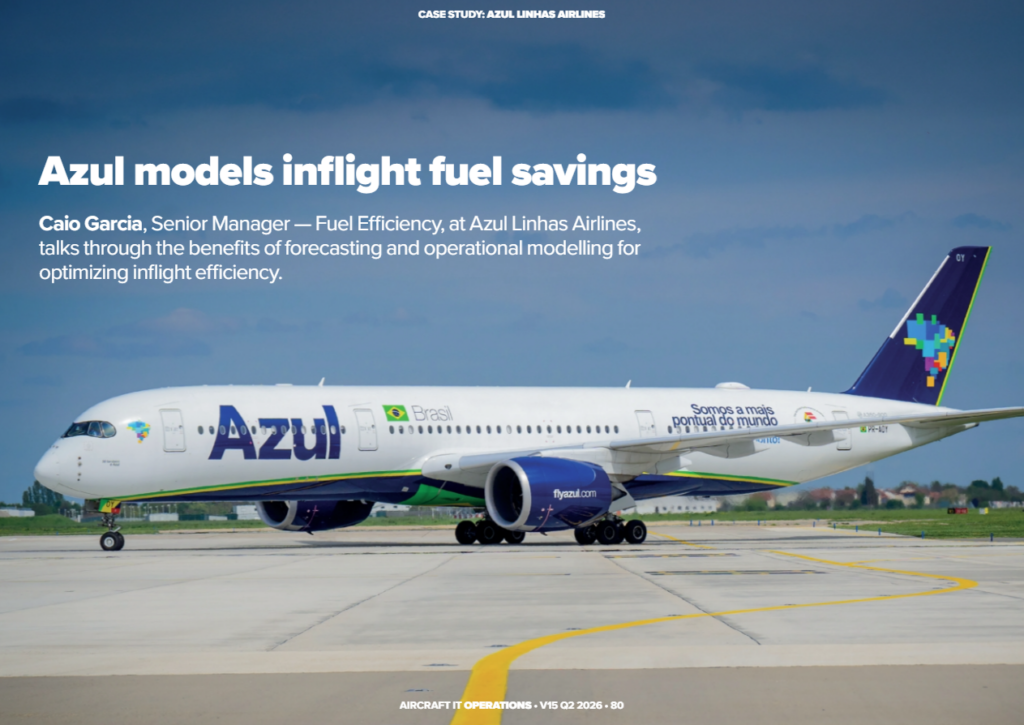
Caio Garcia, Senior Manager – Fuel Efficiency, at Azul Linhas Airlines, talks through the benefits of forecasting and operational modelling for optimizing inflight efficiency.
In this case study, I’ll show readers how Azul reduces fuel consumption by assessing multiple data variables on individual flights using SITA OptiFlight®.
BUSY SCHEDULE
Before we go into the details, a quick overview of Azul Linhas Airlines will highlight the operational challenges that make optimizing in-flight efficiency a key priority for us. We are Brazil’s largest airline in terms of daily departures (see figure 1), the leading provider on 93 percent of our routes, and the only carrier on 82 percent of them.
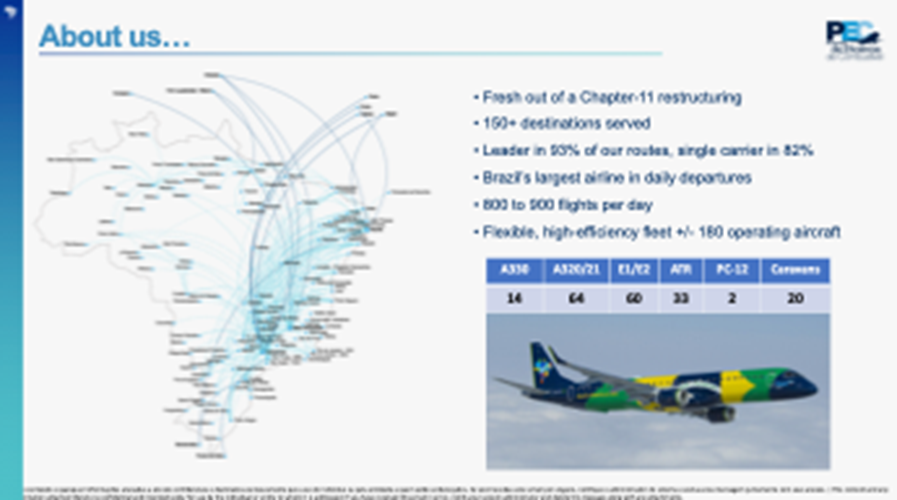
Figure 1
We handle 800 to 900 daily flights with a fleet of around 180 aircraft heading to over 150 destinations. We like to say that we fly to pretty much everywhere there is a runway in Brazil, with a wide-ranging fleet, from the large (Airbus 330) to the small (Cessna Caravan). Our challenge is to improve in-flight efficiency across all aircraft types.
PARTNERSHIP APPROACH
This case study focuses on the suite of OptiFlight® modules from SITA, which was one of our first technology partners back in 2009. Our first contract was for aircraft communication (figure 2).
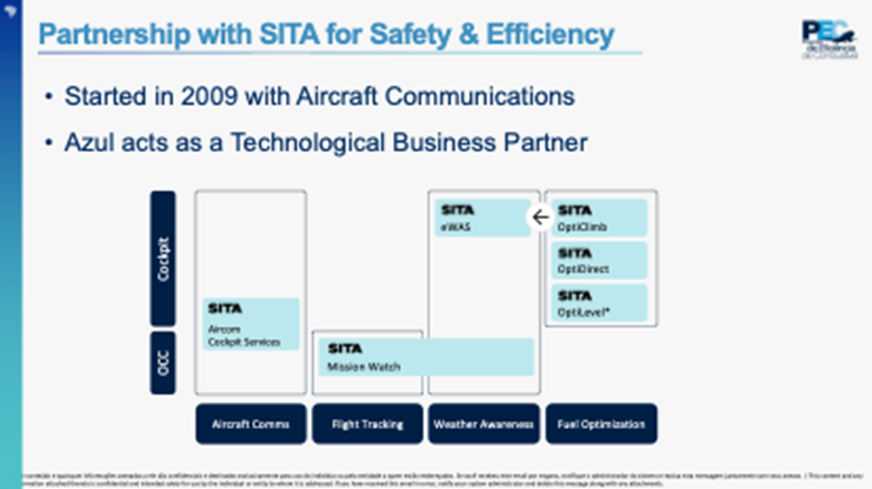
Figure 2
Following that we introduced Mission Watch and eWas (electronic Weather Awareness System) for flight tracking and weather awareness, before taking on fuel optimization with the OptiClimb, OptiDirect and OptiLevel modules.
LEVERAGING FLIGHT DATA
We use the OptiFlight® modules to leverage flight data for building fuel-saving predictive models. The process begins by sending QAR (Quick Access Recorder) data to SITA, which analyzes information on a bespoke tail-specific aircraft basis (figures 3 and 4). For example, each Airbus A320 will have a specific profile and performance characteristics in the modelling system, where it becomes a digital twin for that A320.
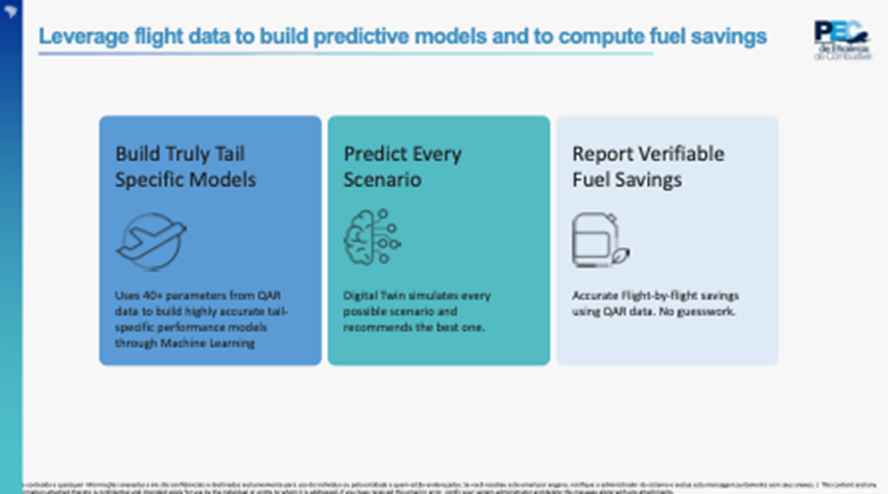
Figure 3
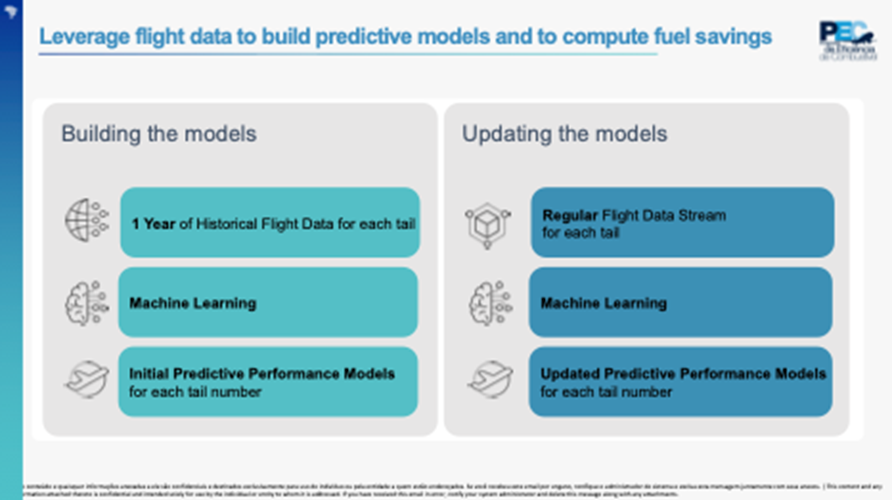
Figure 4
SITA runs scenarios based on the operational environment, including winds, temperature and weight & balance, to understand how the aircraft flies in certain conditions in terms of fuel consumption and performance, all based on historical data. We receive verifiable monthly fuel savings reports that we cross-check against our own measurements.
At the core of the OptiFlight® solution is a ‘what if’ engine, as you can see in figure 5. We send the OFP (Original Flight Plan) and load sheet to SITA for them to understand what the operational environment is going to be for the aircraft’s specific weight and other flight parameters. OptiClimb enters various scenarios into the ‘what if’ engine to find the best solutions for that specific flight and delivers actionable information directly into the pilot workflow.
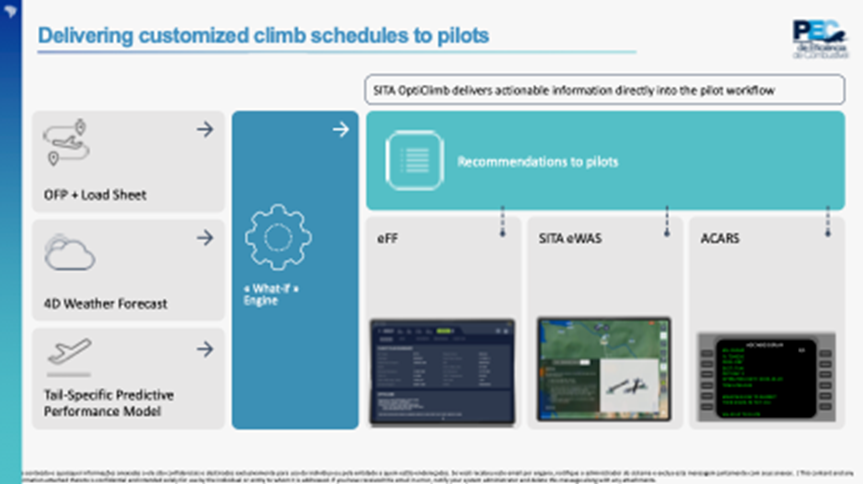
Figure 5
We receive the recommendations three ways: to the EFF (Electronic Flight Folder), eWAS and ACARS (Aircraft Communications, Addressing and Reporting System). We prefer to use eWAS and ACARS, which we find are more reliable and they complement each other.
BEST CONDITIONS TO CLIMB
With OptiClimb, we receive two climb speeds with an acceleration usually above flight level 100. This is a complex phase as there are multiple parameters that are constantly changing. OptiClimb might get us to climb a little bit faster at a higher rate as it finds the best conditions during the climb (figure 6), using power at a uniform rate. We find that OptiClimb’s customized schedule for each flight helps pilots to climb better and save fuel.
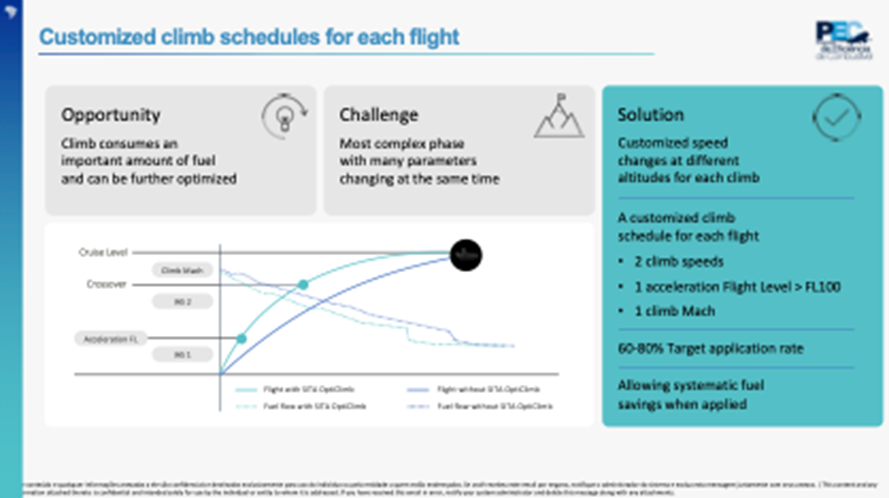
Figure 6
Savings with OptiClimb
Fuel savings with OptiClimb have been significant, as figure 7 shows.
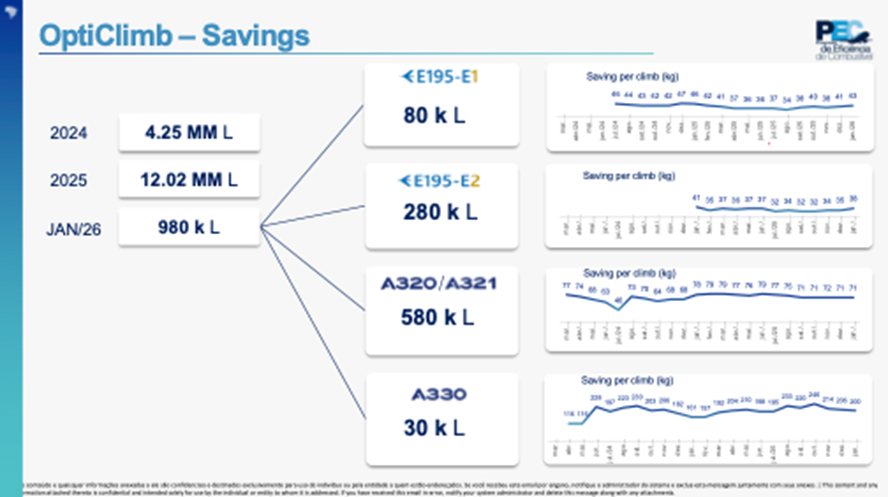
Figure 7
We saved approximately four million liters in 2024 and 12 million liters in 2025. In January 2026, we were at 980,000 liters, which is split in figure 7 per aircraft type. The interesting point here is that when we change a climb profile to save engine time, the model adapts to reflect this.
TAKING SHORTCUTS
It took us about six months to implement OptiDirect, which went live in June 2025. OptiDirect takes historical data from routes flown to identify where we are most likely to benefit by taking shorter options and recommends these before the flight (see figure 8).
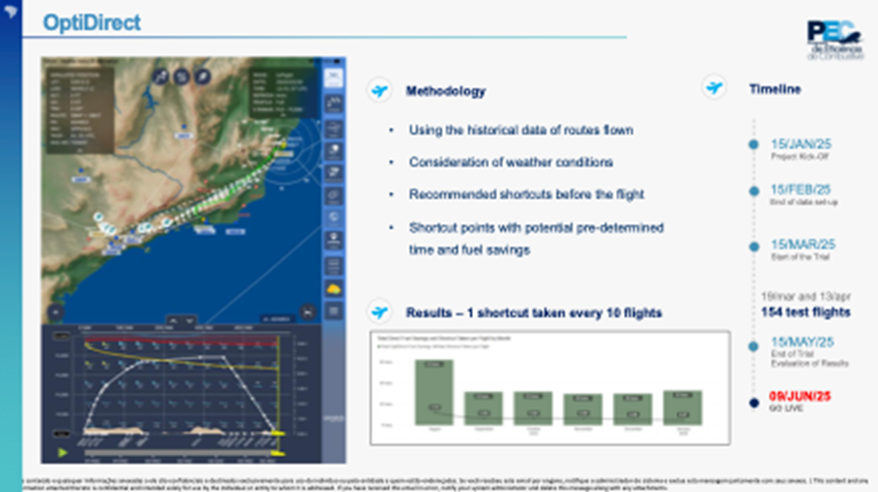
Figure 8
Pilots receive a pop-up on eWAS showing the direct or the most probable direct route. They might choose the most probable route, not necessarily the one that is most efficient. When they click on the pop-up, pilots can see exactly how much time and fuel they are going to save.
OPTIMIZING FLIGHT LEVELS
Currently, we are trialling OptiLevel to optimize the flight level and speed, based on whether we are on time or missing time, to make sure that we are on the most efficient route. You can see this in the green bar in figure 9, which compares where we are flying now with where we should be flying. The fuel mileage per kilo average shows that the higher in the chart we are, the less efficient we are.
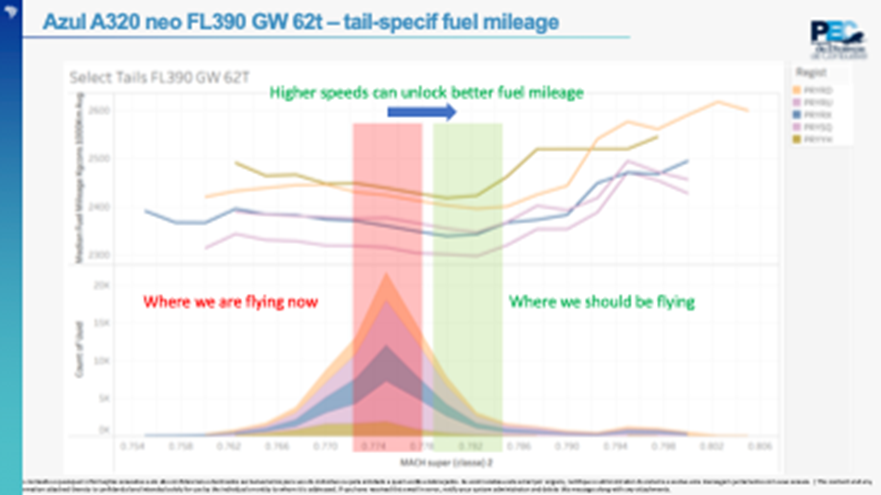
Figure 9
Early, on time or delayed
OptiLevel analyzes the live position, weight, wind, whether the flight is on time and any performance constraints, to give an output for flight level and speed (figure 10). The system tells us to adapt, reduce or increase our CI (Cost Index), climb or descend.
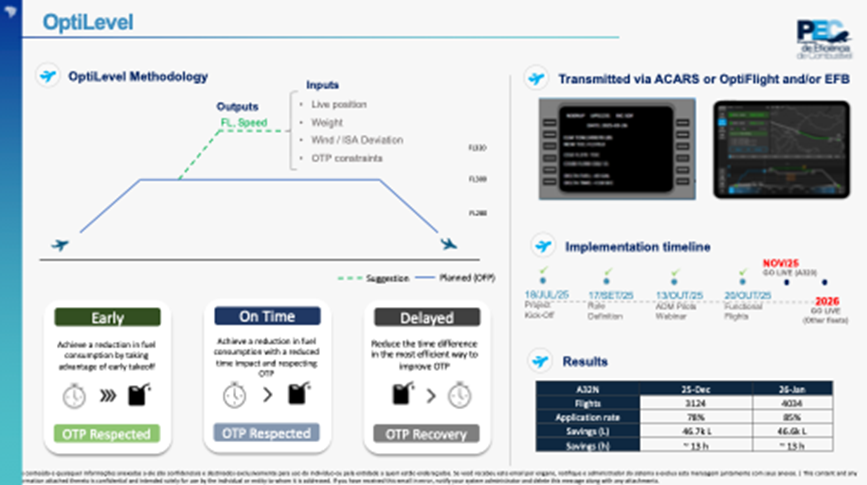
Figure 10
For example, if the flight is early, OptiLevel can adapt the CI to be a little bit more efficient. If we are on time, it will try to optimize our on-time performance and give us a better fuel figure by changing the flight level or adapting the speed a little. If we are delayed, it might recommend an acceleration, detrimental to fuel consumption but maybe better for on-time performance and passenger satisfaction. OptiLevel is configurable by individual airlines, so Azul can set its own parameters.
We went live on Optilevel with our Airbus 320 fleet in November 2025. Results from January 2026 show that we saved about 13 hours of flight time and around 46.7kL of fuel. Not every flight had a recommendation, but the ones that did achieved 85 percent of adherence from the flight crew, which was pleasing for the early adoption of a new tool. Brazil’s airspace is not particularly congested, so we pretty much get what we want most of the time in terms of flight level.
POST-FLIGHT SAVINGS
As well as pre-flight savings calculations, SITA generates post-flight savings reports, which are also tail-specific. It creates a shadow flight to test the flight in that environment and compares it with the QAR data (Quick Access Recorder data) from the actual flight (figure 11).
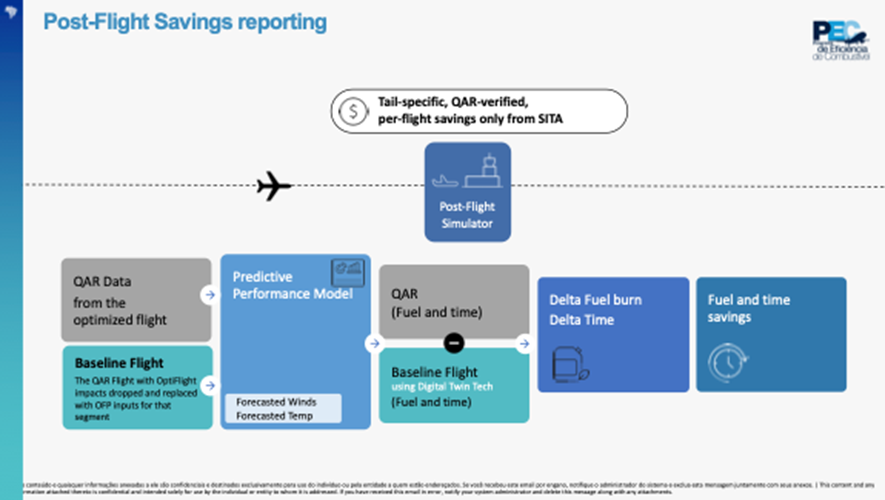
Figure 11
This gives us both a tail-specific recommendation and what the actual flight did in the fuel and time savings report. From our trial of OptiLevel, we can see that it is a robust model for calculating time and fuel savings.
OVERCOMING HURDLES
At the moment, we are working through several challenges with OptiLevel to mitigate any risks they might pose (see figure 12). These include reducing the incidence of duplicate messages coming from our systems. CI identification is another challenge, especially extracting information reliably from the FMS (Fuel Management System), which we are sorting out. We are also adapting our TOD (Top of Descent) adjustment to make the descent as efficient as possible.
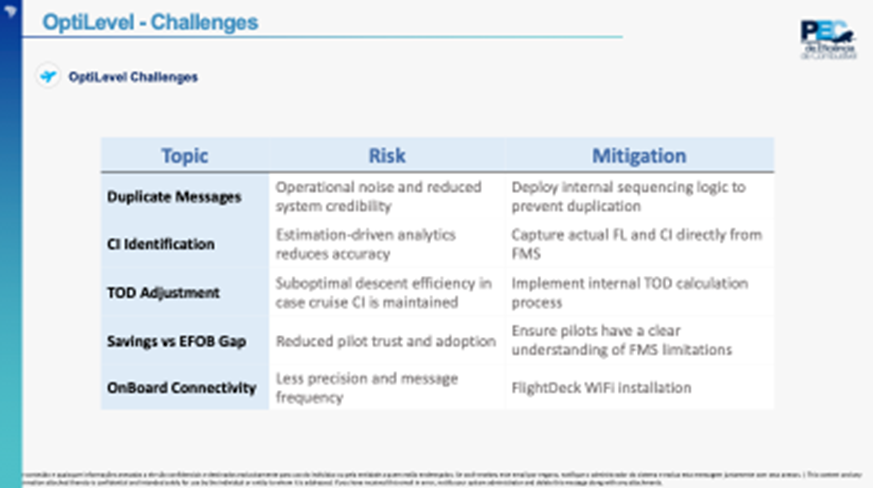
Figure 12
Pilots like the FMS, but it has its limitations, so we are in the process of explaining to pilots how the FMS and SITA systems work. This involves aligning SITA calculation logic with FMS outputs.
Last but not least is the question of onboard connectivity, which, for us, is hampering progress. Without Wi-Fi on the flight deck, it’s hard to extract the maximum from SITA’s tools. This year, we are working to put Wi-Fi on the flight deck, which will take our use of OptiLevel to the levels of inflight efficiency improvement we have achieved with OptiClimb and OptiDirect.
WEATHER CHECK
For weather-specific support, eWAS is another valuable tool (figure 13).
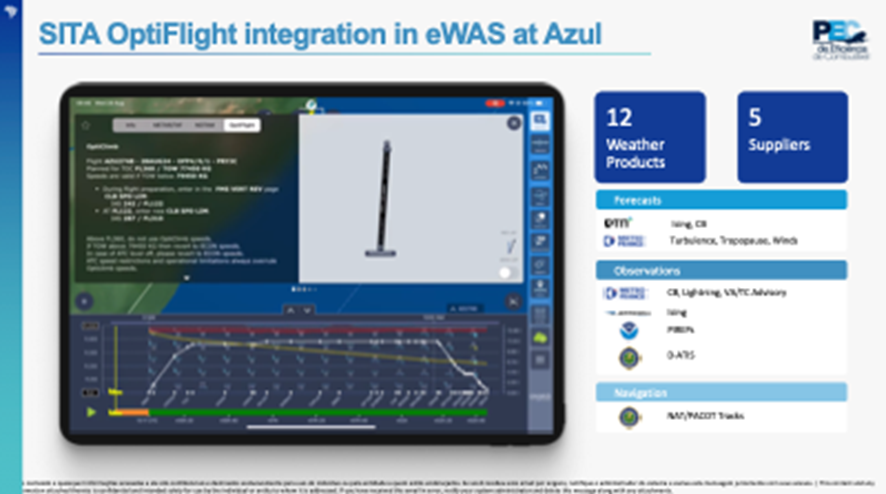
Figure 13
It is particularly useful because it covers a dozen weather products from five suppliers and is our pilots’ primary weather tool, especially with turboprop ATR pilots, because this aircraft is very sensitive to icing.
MISSION WATCH
Finally, a brief mention of Mission Watch (figure 14) concludes this case study. We use Mission Watch for OCC (Operations Control Center) flight tracking, in monitoring data such as weather hazards, fuel over-consumption and deviation from track.
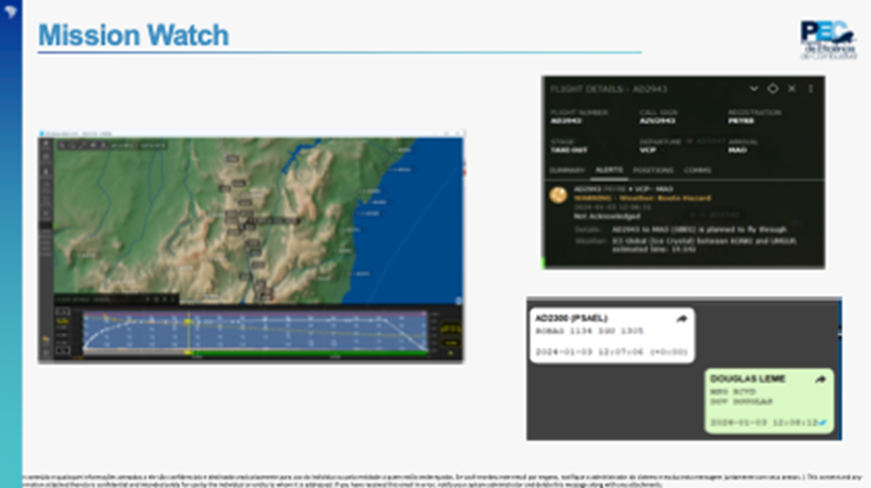
Figure 14
Mission Watch automatically sets up everything necessary for warning dispatchers, so we need fewer dispatchers working on flight tracking.
Comments (0)
There are currently no comments about this article.
To post a comment, please login or subscribe.