Articles
| Name | Author |
|---|
Using Flight Data to support fuel savings at Transavia
Author: Emmanuel Cachia, Flight Operations Director, Transavia
Subscribe
Using Flight Data to support fuel savings at Transavia
Emmanuel Cachia, Flight Operations Director, Transavia and François Chazelle, CCO, Safety Line share a case study on improving fuel performance in the climb
Before launching into using data to improve fuel efficiency, the main topic of this article, we’ll start with some background information about Transavia France, the subject of the case study.
TRANSAVIA FRANCE
Transavia is the low-cost airline in Air France KLM. In 2016 Transavia Group carried more than 13.3 million passengers and more than 14 million during 2017. The business has one name but includes two carriers. Transavia Netherlands has been operating for more than fifty years (since 1966) and now has a fleet of 42 aircraft flying 204 routes across 29 countries. Transavia France, the focus of this case study, commenced operations in 2007 and currently flies 33 aircraft on 82 routes across 22 countries. All the aircraft in Transavia France are Boeing 737-800 types ranging in age from the brand new aircraft in the current delivery program to some that are more than 20 years old: this age difference means that their performances will vary depending on each aircraft’s age and history (some of the older aircraft were acquired second-hand). The route network, from three bases at Paris, Nantes and Lyon, includes 140 flights per day serving 90 destinations.
FUEL EFFICIENCY INITIATIVES
In Transavia France, fuel efficiency best practice was first initiated in 2010, linking up with a fuel efficiency partner, Openairlines in 2013 when the airline was the launch customer for SkyBreathe fuel efficiency solution. SkyBreathe provided a dashboard with five KPI (key performance indicators) to follow the application rate of five best practice initiatives. The first initiative was engine-out taxi-in, the second was NADP (noise abatement departure procedure), the third was CDA (constant descent approach); there was also an initiative on extra fuel and, the last one, the use of idle reverse. From these five best practices, the airline has already achieved a saving of nearly 44kg per flight in 2017. That equates to 1,647 tonnes of fuel saved in the year which, in turn, translated to a reduction of 5,188 tonnes in Transavia France’s carbon footprint.
Since 2015, Transavia France has been the test customer for OptiClimb from Safety Line and, in April 2016, became the launch customer for OptiClimb which was extended to cover all Transavia France and Transavia Netherlands fleets by the beginning of 2018.
Transavia – Safety Line partnership timeline
The first meeting between Emmanuel Cachia and Pierre Jouniaux at Safety Line took place in the first quarter of 2015. Safety Line was looking for an airline to undertake test flights to confirm the principles of OptiClimb over a series of 100 test flights, with a fuel saving target of about 100kg per flight using the tool. The tests started in 2015 on 100 flights with a small team of pilots and resulted in the principles being confirmed, albeit the saving was a little less than forecast at between 70 and 80kg per flight. The airline and service provider decided to extend the test group to 10% of Transavia France pilots and to conduct further tests over a longer time during the summer of 2016. During this period, about one thousand flights were flown with OptiClimb. From the beginning, the goal in Transavia France was to have a new tool to save fuel but the solution must also be safe and simple to use for pilots. So, from the beginning of this test period, the airline developed and tried to find a solution that would be very close to the Boeing procedures for pilots. To this end, a process was developed for which pilots would just have to enter the speeds and altitudes into the FMC (Flight Management Computer) during the pre-flight process, after which the climb profile is automatically flown by the auto-pilot.
After the test period of about five months, it was concluded that a fuel saving of about 75kg per flight had been achieved with an application rate of almost 75%. That was quite good but the airline was not totally confident with the result because they are measured by the provider. A solution was needed to confirm the results, it was impossible internally so Transavia asked their other sub-contractor OpenAirlines to check the results – it was difficult to do the savings calculation, and so the confirmation was that there had been a fuel saving but the amount saved was not certain. So, the decision was taken to extend the test period, to increase the number of flights and, from the beginning, there were discussions between the airline and colleagues in Transavia Netherlands to explain the goal with the new tool so that, in 2017, for the second test period, both operators in the Transavia group undertook test flights in the summer of 2017. At the end, using SafetyLine and with the increased number of test flights, the methodology was changed to better calculate the savings as a statistical comparison with a database of reference flights with the same conditions, same aircraft, same Top of Climb, same take-off weight and the same temperature. By the end of the summer of 2017, across both Transavia carriers, the airline was confident with the results which were comparable with previous findings, i.e. about 75kg per flight fuel saving. Contracts were signed at the end of 2017 and, since February 2018, this new process has been implemented by the two carriers in their FCOM (flight crew operating manual).
[[This is too large a body of copy for a text box but the copy for the next two sections, ‘HOW OPTICLIMB WORKS’ and ‘HOW THE SAVINGS ARE ANALYSED’, should be distinguishable from the generic case study copy by either a slightly different background colour or font colour.]]
HOW OPTICLIMB WORKS
The FMS (flight management system) is aircraft centric; it has limited capabilities because it’s older generation equipment for very good reasons – it’s a critical system and it has to be extremely reliable. However, with that ‘tried and tested’ reliability come those limited capabilities in terms of calculation power, storage capacity for performance and navigation databases and so on. OptiClimb calculations are made on the ground using mainframe computers. Also the FMS uses generic OEM performance models which OptiClimb replaces with machine learning based performance models for each tail number, achieved through applying machine learning to the historical flight data for each tail number. And the system uses weather forecasts which give temperature inputs every 1,000 ft. for any climb trajectory that’s calculated (instead of just the temperature and winds at top and bottom of climb, which is what the FMS uses) and will calculate thousands of combinations before recommending the best one to the airline. Once these optimization calculations have been done, the results are sent to the pilots as part of the briefing package to be able to implement the OptiClimb climb speeds for each specific flight.
The machine learning performance models are generated by acquiring the flight data for the last 200 flights of each tail number and with these last 200 flights the solution will build not only a thrust model but also an aerodynamics model and a fuel flow model, and then these models are used to make predictions of the fuel consumption of any trajectory that’s calculated in order to choose the optimum one.
In regular use, OptiClimb will collect the flight plan from the airline and, with the flight plan information, including the tail numbers so that the right performance model is used, OptiClimb will use the take-off weight, the top of climb and the cruise speed in order to run an optimization calculation of the optimal trajectory that will deliver the best result. These trajectories are achieved through speed changes: for ECON climb, the FMS will only give one speed for the whole climb whereas OptiClimb uses up to three speeds adapted to individual aircraft performance, weather inputs and the altitude at which the speeds are being changed. The purpose of the optimization will be to bring the aircraft to top of climb, over the same point on the ground at the same time as an ECON climb would do, but having followed a more efficient trajectory.
That might seem complicated, but OptiClimb turns it into something very simple so that, when the pilot receives an OptiClimb schedule with the recommended speeds, he just has to enter two lines into the FMS using existing functionalities – the speed restriction function and the target speed function – to enter those three speed and altitude combinations which will be different for each flight and then the flight will be automatically flown by the FMS. So, in summary;
- OptiClimb receives the flight plans…
- … and completes the optimization calculations using machine learning performance models and weather inputs;
- The OptiClimb schedule is sent to the pilot as part of the briefing package;
- The pilot enters it into the FMS during the flight preparation phase;
- The flight is then flown.
HOW THE SAVINGS ARE ANALYSED
Let’s start by looking at two similar flights (figure 1.1) with and without OptiClimb to compare the flight profiles there; but, when flights are being compared, much larger numbers of flights are used.
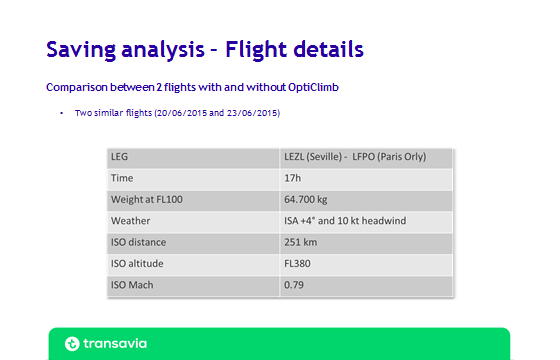
Figure 1.1
Looking at the two flights in figure 2.1, they were just three days apart with the same aircraft on the same leg, Seville to Paris flying at the same weight, the same height, temperature, weather, to the same type of climb. It’s not easy to find these kinds of flights but it was lucky that these two were available. Looking at them, they are very comparable but you can see the key differences between the ECON climb flight and the OptiClimb flight (figure 1.2).
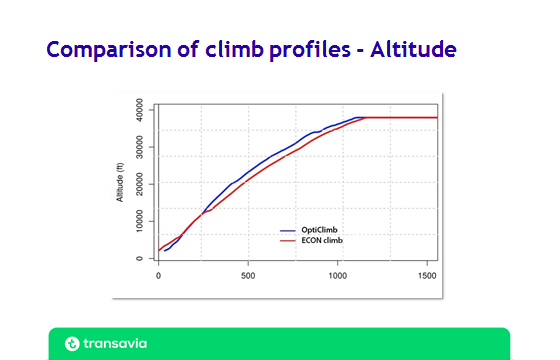
Figure 1.2
The ECON climb flight is in red and, at flight level 100, you see the acceleration when the red line is flattening out a little just after flight level 100; that’s an acceleration from the 250 knots which is the constraint up to flight level 100 to the ECON speed which is usually higher. However, the blue line, representing the OptiClimb, at that point continues to go up. In fact usually there will be a lower speed at that stage so a higher climb rate and that means that, from that point onwards, the OptiClimb schedule will be above the ECON schedule and, usually when flying at a higher altitude, less fuel is consumed. The other thing is that, when the top of climb is reached earlier with OptiClimb, it takes into account the cruise bits that need to be covered to reach the same distance and the acceleration at that level is also taken into account but accelerating at top of climb will use less fuel than accelerating at flight level 100. These (figure 2.2) are the observations just looking at the altitude versus time.
If we look at the fuel flow (figure 1.3) for those two flights, we see much the same thing.
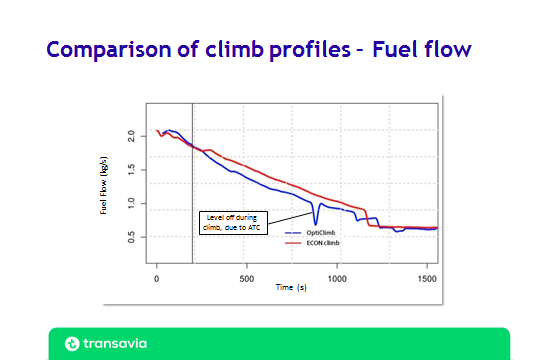
Figure 1.3
The red line separates when the ECON climb flight accelerates from 250 knots to ECON climb speed and, from that point onwards, the red line stays above the blue line in terms of fuel flow so there is higher fuel consumption with the ECON climb flight than with the OptiClimb flight. And, as if to illustrate that these were QAR data from real flights, there was a short level off during the OptiClimb flight due to Air Traffic Control but it didn’t have any impact on final results. You can also see a small crossover at the end when the blue line crosses over the red line: that’s when the aircraft accelerates at top of climb, a bit of fuel is lost there but far less than has been gained throughout the climb; so this illustrates typically what will happen when and ECON climb flight is compared with an OptiClimb flight.
All that said, to calculate savings in a reliable manner it is necessary to look at large numbers of flights, with a statistical approach because of all the parameters involved. A reference database has to be built using historical data from ECON climb flights of which there are plenty. The ECON climb flights are grouped by four parameters and all ECON climb flights having the same parameters will be part of that group when they have the same:
- Tail number;
- Gross Weight;
- Top of climb; and
- ISA deviation.
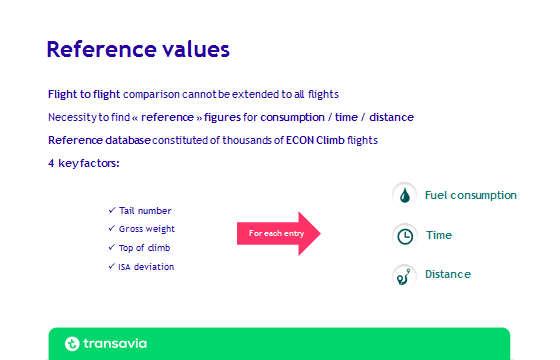
Figure 2
Safety Line found these to be the four parameters (figure 2) that influence climb the most with the exception of wind. If there is a large enough group of flights it will represent an average wind and the idea will be that when the OptiClimb flights are looked at there needs to be a very large number of those as well to ensure that the wind is averaged out in the same way. All these groups of flights will look at the average fuel consumption, time and distance; and that will be a reference database for any flights that have the same four parameters.
All of this information is made accessible to users in a very transparent way through access to a web interface where they can look at the savings, flight by flight, compared to the reference figures and also have a more overall view of the average savings over large numbers of flights for the operations. Transavia France has access to this database and anyone can comment on the results.
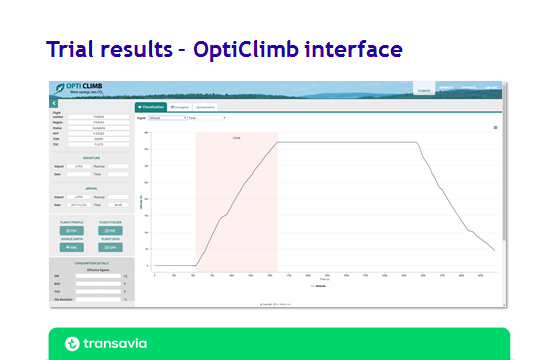
Figure 3.1
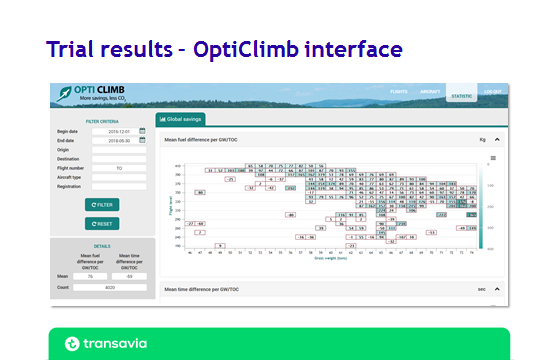
Figure 3.2
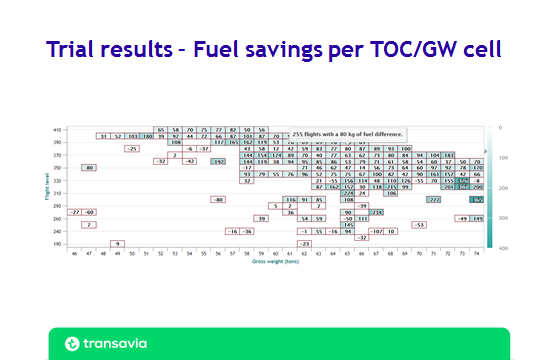
Figure 3.3
With the interface, it’s possible for Transavia to examine each flight for the climb phase (figure 3.1; period shaded pink) and, with a lot of filters, it’s possible to see the average fuel saving per aircraft, per destination during the period (figure 3.2) and so the information is available per top of climb and gross weight (TOC/GW) cell (figure 3.3). Each cell provides fuel saving and the number of flights that fit the cell TOC/GW is also known. It’s also possible to zoom in on a cell and see how many flights have been completed to that TOC/GW and the fuel saving.
IMPLEMENTING OPTICLIMB AT TRANSAVIA
The set-up was carried out over three stages (figure 4).
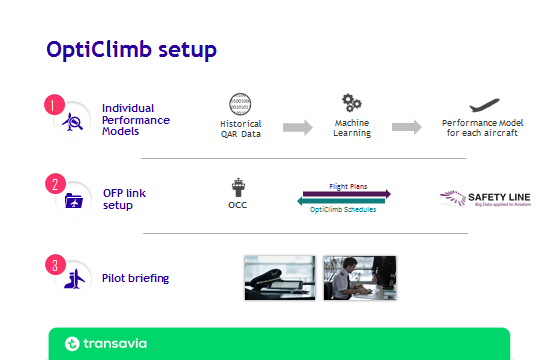
Figure 4
First was the accrual of historical QAR (Quick Access Recorder) data by Transavia France for Safety Line to use with machine learning in order to generate a performance model for each aircraft. The second stage is for the OFP (Operational Flight Plan) link set and the third step is pilot briefing.
Stage one, the generation of individual performance models. As we’ve already seen, Transavia France provides flight data to Safety Line who then does the rest. All Transavia has to do is give access to that QAR data at least every quarter. From each new batch of flight data, Safety Line take what they need to use to update the machine learning performance models for each aircraft.
Stage two is the OFP link set-up between Lido Flight Planning, Transavia’s flight planning system, and Aviobook, Transavia’s EFF (Electronic Flight Folder). Transavia France also requested Safety Line to support automating the sending of the OFPs to Safety Line for computing OptiClimb schedules and the pushing back of those OptiClimb schedules into the Aviobook Flight Box for display on the pilots’ iPads.
The third stage is the pilot briefing for which Transavia France developed, with Safety Line, two pages of instructions to explain to pilots what OptiClimb is and what it does, what is the goal and how it will be implemented in the documentation. The training was very simple. About one thousand test flights were needed to ensure solid statistics and to have something that would be accurate for the operational phase.
OptiClimb schedules are presented in Transavia France’s briefing book, in the briefing package and in Aviobook. Transavia receives the speed and height in the flight box and so there are just two lines of speed that have to be entered in the FMC in the Climb page. At Transavia’s request, Safety Line has also developed an integration with the SkyBreathe dashboard from Open Airlines to allow Transavia to visualize on their dashboard each month the results of the fuel saving and the application rates by pilots.
SAVINGS
As we’ve already seen, between March 2017 and April 2018, Transavia France did more than 4,000 flights (figure 5) with the OptiClimb schedule and generated a mean fuel saving of 76kg per flight while the mean increase in time has only been +58 seconds.
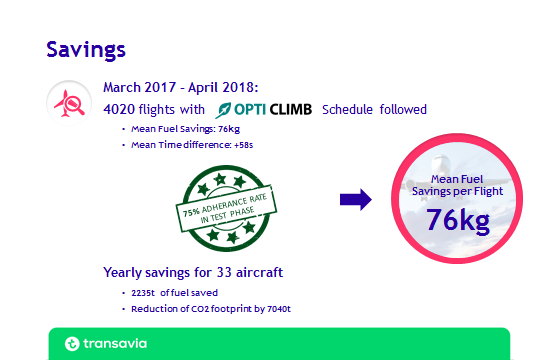
Figure 5
There was a very good adherence rate by pilots of 75%. Why that is not 100% could be the result of an ATC constraint with speeds, it could be weather or it could be a technical problem which prevents the information from reaching the EFF. Also, while it is standard practice in Transavia France to now use OptiClimb, the airline also understands that there are occasions, usually related to ATC speed constraints, when pilots cannot meet the speed target. So if they have to diverge from the OptiClimb speeds targets they can come back to the ECON climb that’s still in the FMC; it’s that simple.
Across the whole fleet, it’s reasonable to aim to save 2235kg of fuel (roughly $1 million worth) in 2018 and to reduce Transavia France’s CO2 footprint by 7,040 tonnes.
Contributor’s Details

Emmanuel Cachia
Emmanuel graduated from Engineering School (ISMANS) in 1999 and had gained his private pilot licence at 17, in 1994. He did commercial pilot training in 2000 and started in August 2001 as first officer on Embraer 120, at Octavia Airlines. Emmanuel has always combined ground responsibilities with a pilot position and started writing operational manuals leading to had various positions since 2001. He is now VP Flight Operations in Transavia and is still flying as Captain and line training captain.

François Chazelle – CCO, Safety Line
CHIEF COMMERCIAL OFFICER (CCO)
International aviation sales executive with a solid experience of opening new markets worldwide, François sold commercial aircraft and corporate jets during 12 years with Airbus as well as aviation technical and financial services, respectively with Bureau Veritas and Aviation Finance Company.

Transavia
Transavia is a low-cost airline and part of the Air France-KLM group. Transavia France commenced operations in 2007 and currently flies 33 aircraft on 82 routes across 22 countries. All the aircraft in Transavia France are Boeing 737-800 types
And the airline operates from three bases at Paris, Nantes and Lyon. It flies 140 flights per day serving 90 destinations.
 Safety Line
Paris based Safety Line offers Big Data software solutions for the safety and efficiency of airline and airport operations with a focus on fuel and CO2 emissions reduction. The combination of a solid expertise in aviation associated with patented research in data science applied to air transport allow Safety Line to offer uniquely innovative solutions to airline and airport operators. OptiClimb is an innovative fuel saving initiative
Comments (0)
There are currently no comments about this article.
To post a comment, please login or subscribe.