Articles
| Name | Author |
|---|
CASE STUDY: Saving fuel in the climb at KLM Cityhopper
Author: Torsten van Kouwen, Business consultant ATM and & Matthies Dubelaar, Business Pilot Digitizing; both at KLM Cityhopper, Flight Operations
Subscribe
Torsten van Kouwen, Business consultant ATM and & Matthies Dubelaar, Business Pilot Digitizing; both at KLM Cityhopper, Flight Operations
In this case study, we’ll share with readers how our partnership with SITA is transforming fuel efficiency and operational performance at KLM Cityhopper. To do that, we’ll take you through the process of selection and implementation as well as integrating OptiClimb and eWAS into our operations. We’ll highlight the key results and explore what makes this collaboration so impactful. But first, a brief introduction to KLM Cityhopper.
KLM CITYHOPPER
KLM Cityhopper’s fleet of 68 Embraer aircraft, including E175, E190, E195-E2 types, focuses mainly on relatively short regional flying and feeder services for KLM’s long-haul service. We operate more than 300 flights a day to over 70 European destinations and focus on doing this in an efficient and sustainable way to fully optimize fuel consumption. To this end, we are investing in modern, fuel-efficient aircraft, the Embraer E2 series and we aim to be Agile.
OPTIMIZING FUEL EFFICIENCY
For KLM Cityhopper, the program to optimize fuel efficiency, had been underway for some time before the implementation of SITA OptiClimb. Readers will be familiar with the idea of starting with easier changes – ‘harvesting the low hanging fruit’, as in figure 1.
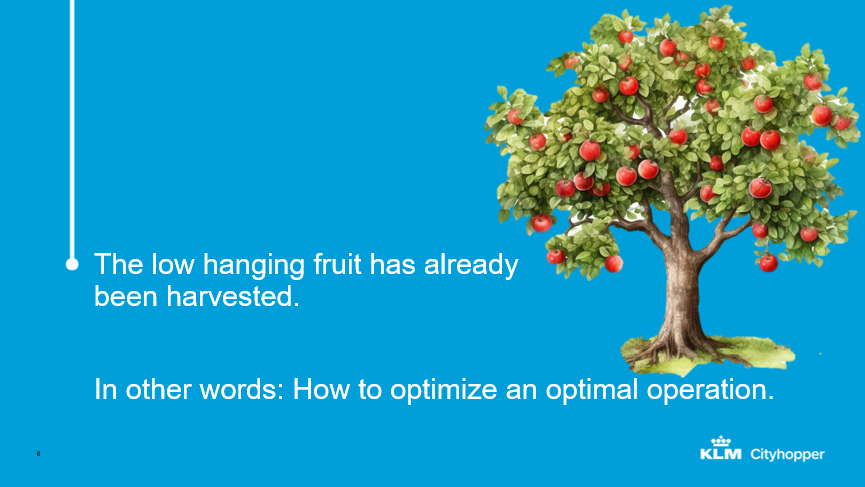
Figure 1
However, as far as fuel efficiency at KLM Cityhopper was concerned, the low hanging fruit had already been harvested, and we’d reached the stage where we need to further optimize an already optimized operation. The question was, how could we do that? Figure 2 illustrates how the ‘low-hanging fruits’ idea can be extended to include every level of the need to improve.
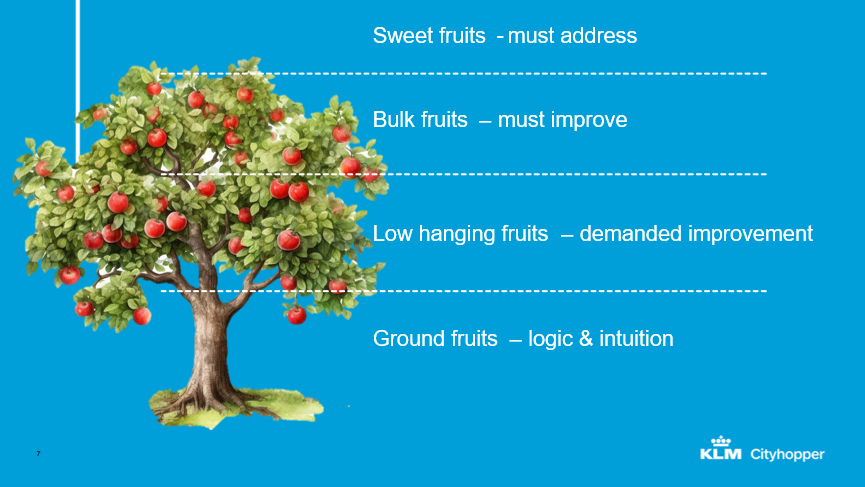
Figure 2
It starts with the ground fruits, the lowest fruits, which are those straightforward changes that can be done with logic and intuition; essential improvements that, in this case, had already been done before the program had started. Then there are the low hanging fruits, things that demand improvement, and, as we’ve already noted, had already been harvested before this case study. It’s also easy to determine what the fruits are and what the implications will be; but it is the sweet fruits that can deliver the most impactful improvements. However, they are harder to access so that, to reach them, we need sophisticated tools, deeper data analysis and strong partnerships; that is where SITA came into the picture. Figure 3 offers some ideas of what, for KLM Cityhopper, were the low-hanging fruit in the past.
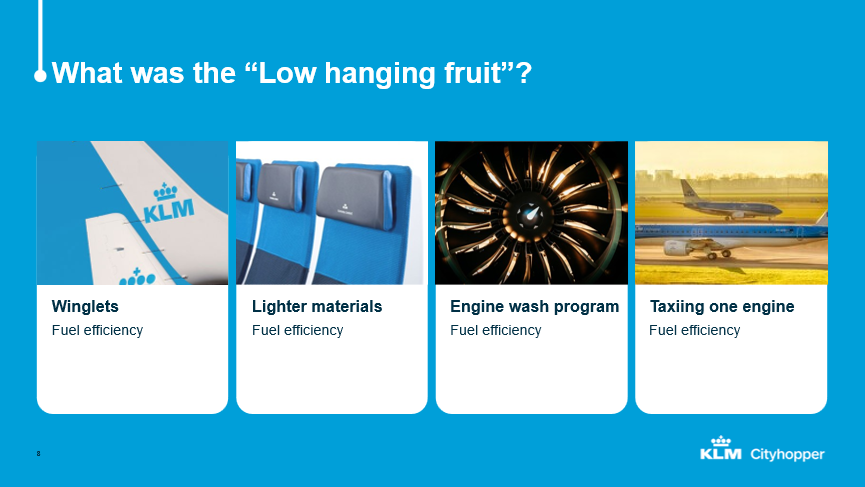
Figure 3
Most of them have done by the airlines and by the aircraft OEMs. Things like winglets, lighter materials and seats, engine wash programs and one engine taxing as a standard operating procedure (SOP). So, we have had to think about new challenges and new opportunities to save fuel,
For fuel efficiency improvement, CO2 emissions reductions and operational enhancement, new aircraft, like the Embraer E2, have played a big role as have more accurate flight plans and up-to-date data in the cockpit, which makes cockpit connectivity almost a requirement. However, airlines don’t have the capacity to do everything themselves, we need help with some specialist programs. And that’s where SITA came into play and became important; to carry out analyses and present them to the airline in a clear and correct way. We see that as creating success together.
WORKING WITH OPTICLIMB & eWAS
It’s almost three years now, since we were first was introduced to SITA and the OptiClimb trial that we did but, finally, we implemented it. We started with the trial in 2020 and KLM Cityhopper has been using OptiClimb since 2024. Together with Cityhopper, KLM is also using OptiClimb and eWAS. It’s given us fuel reduction, CO2 reduction and noise reduction. Because OptiClimb means a steeper climb out, the aircraft’s noise footprint is smaller, which is quite a big impact around Schiphol Airport nowadays.
The reason why we only look at the climb phase is that we analyzed fuel use in different flight phases, as can be seen in figure 4.
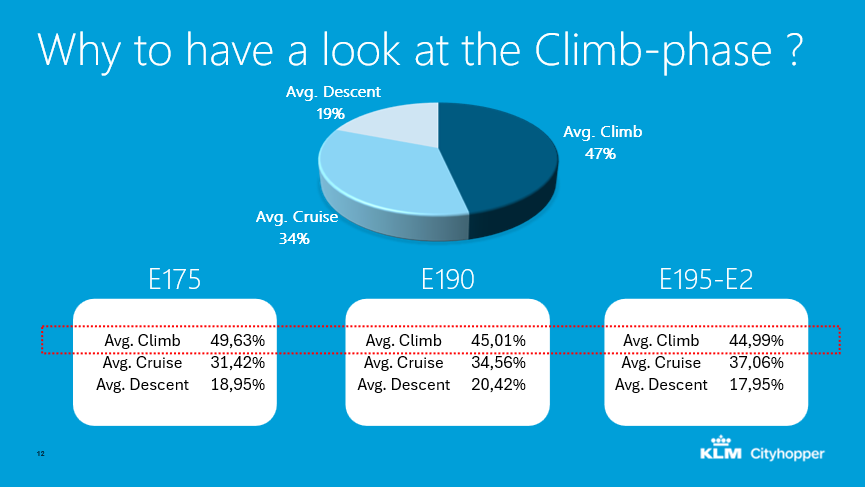
Figure 4
What you can see here is that our average climb phase uses about 47% of the flight fuel. Only 34% is used in cruise and 19% in descent. So, the most advantage we can get is in the climb. And this is where OptiClimb came into the picture. Knowing KLM, we had some quite hard questions for OptiClimb.
- Why is OptiClimb better than other vendors developing tools for analysis?
- Can you get this automatically in our system?
- Is there a weather forecast used for the process?
You can see in figure 5 what the main questions were where we got all the answers
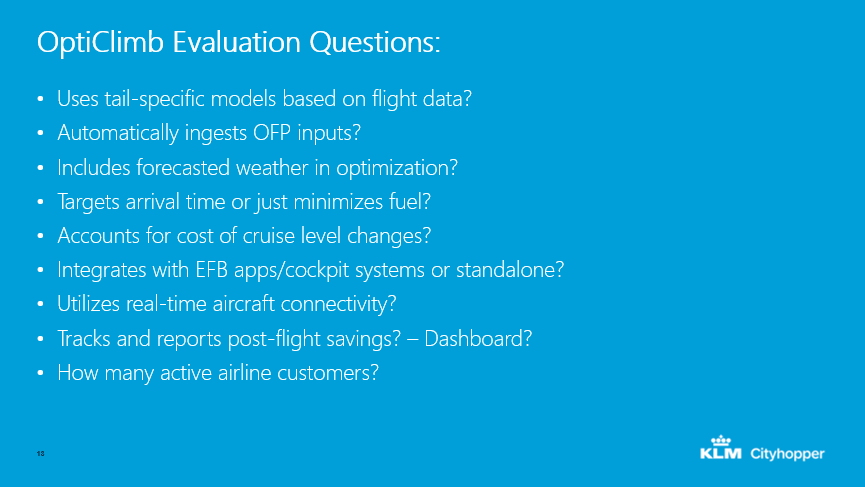
Figure 5
For the second to last one, the dashboard, is something that SITA was working on at the time of writing. Currently, we get the results, the data, on a PDF, but all this will, in the future, be done on the dashboard.
Historically, the information of engineering needed by OptiClimb to get it working was that you need one year of historical data for a tail specific model, then huge machine learning predictive performance models as in figure 6.
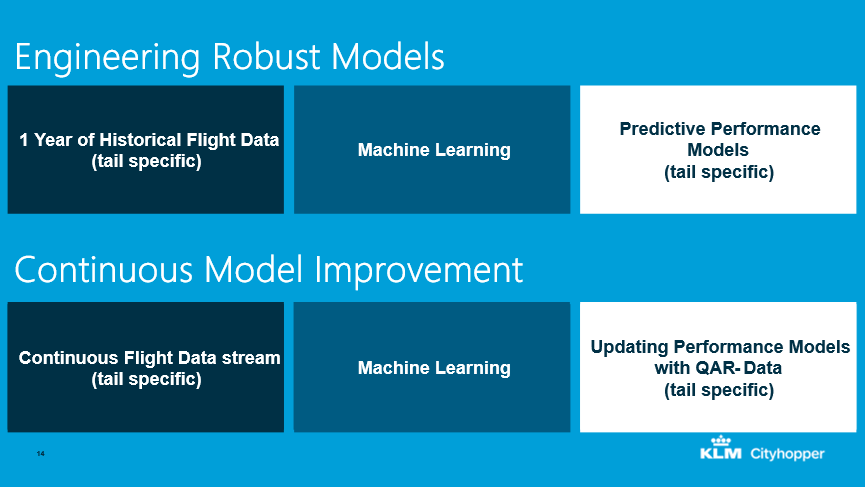
Figure 6
And it doesn’t stop there. You need to continuously improve the model. So, we have continuous flight data stream which is tail specific and, again, machine learning, an updated performance model with QAR (Quick Access Recorder) data, also tail specific, and that’s done for every flight. Every flight is sent to SITA.
In figure 7 there is an illustration of flight-to-flight comparison methodology.
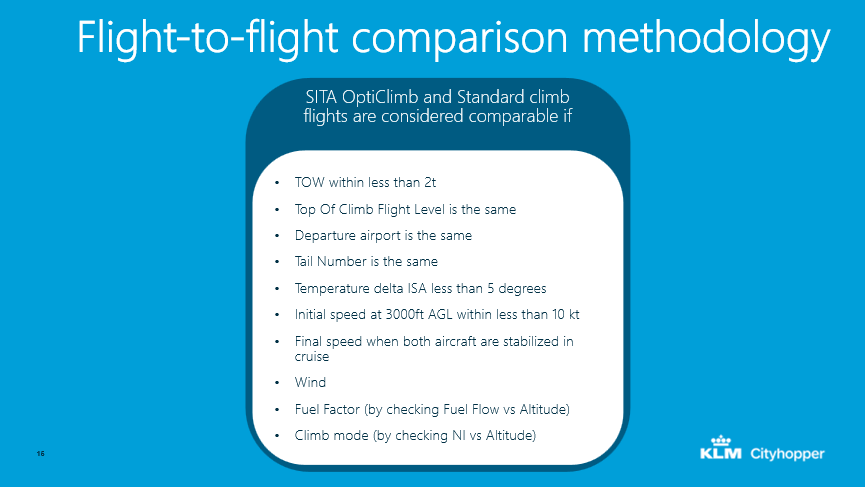
Figure 7
SITA OptiClimb and Standard climb flights are considered comparable if take-off weight is less than two tons in difference and if top of climb level is the same. departure airport is the same and tail number is the same. Comparing these flights is where SITA does the magic and delivers the right considerations for the flight. The standard is very high.
HOW OPTICLIMB WORKS
As you can see in figure 8, we get an Operational Flight Plan from our vendor, 4D weather forecast and a tail- specific performance model. Our flight plan is sent to SITA; it is computed on the SITA service which sends a presentation to our pilots into the cockpit by our flight deck printer.
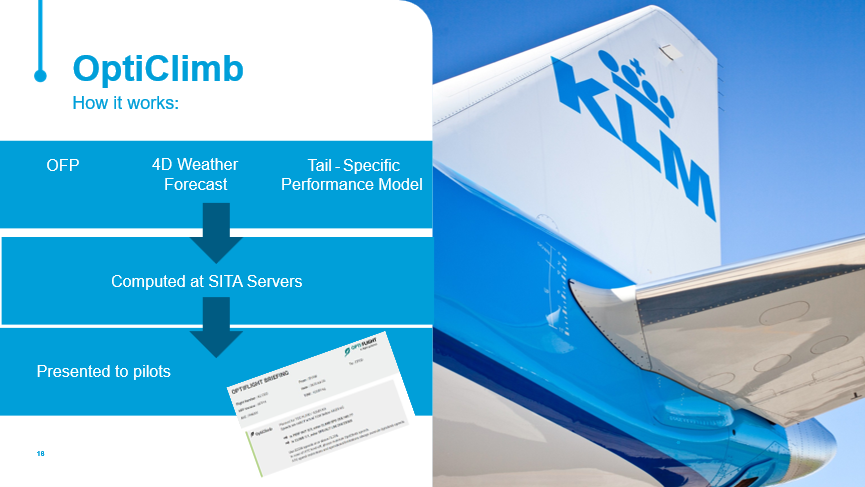
Figure 8
What you see in figure 9 is the comparison between a normal climb-out and a OptiClimb-out.
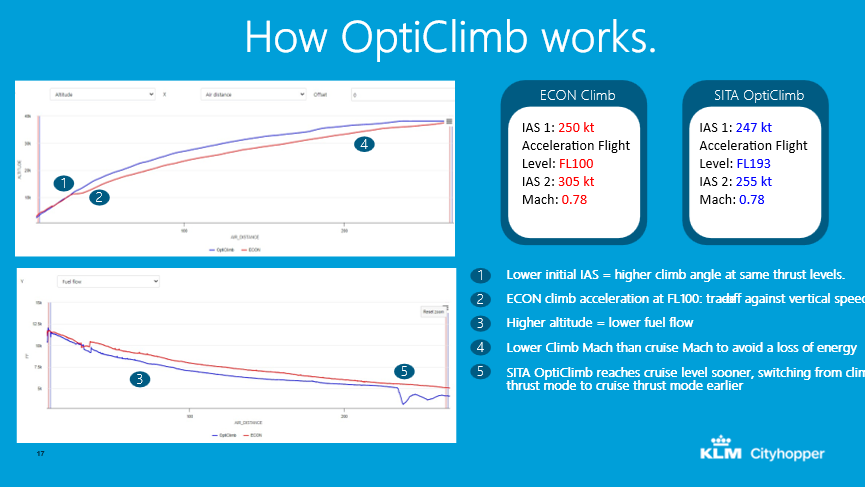
Figure 9
The blue line is the optimized climb-out, and the red one will be a quicker acceleration. We keep our indicated air speed without the time lower to reach a steeper climb, to reach our top off climb earlier and have a longer cruise, where we save fuel and CO2, and reduce the noise around the airport.
Figure 10 shows how it’s all presented to the crew.
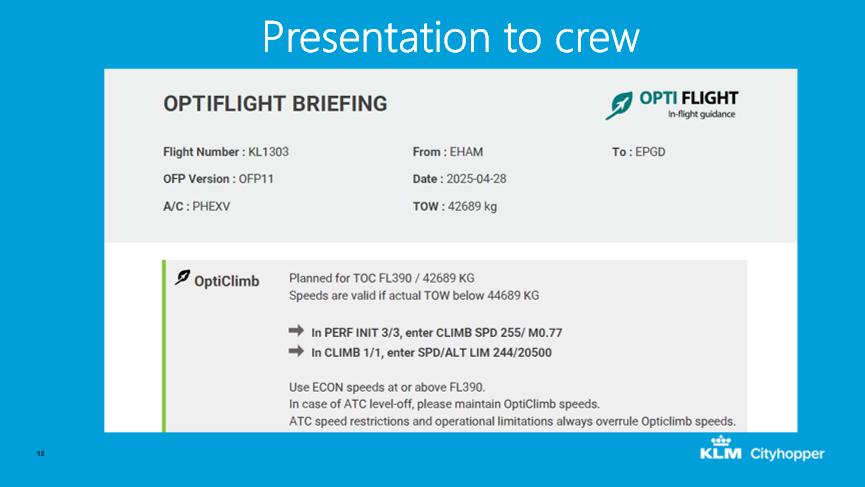
Figure 10
There’s a standard advice which looks the same for every flight, only the number is different, and we present it in the flight deck app so the crew has it directly when they enter the cockpit, and they’re able to put it into their systems. It’s actually quite easy and boils down to two different speeds.
The first speed is what you have to enter on the performance page of the Embraer which looks a bit different from other aircraft types. Figure 10 shows how it looks for us on the Embraer. It suggests that we should fly for 10 minutes at reduced indicated air speed and reduced Mach number in order to reach Top of Climb (TOC) quicker. OptiClimb looks a little bit different for each sector, so for the example in the figure, it was a lower speed than 250 knots up to a higher acceleration Flight Level. The second part is that we’re directed to keep the initial speed up to 14,000 feet for 10 minutes in the climb phase as well. What this does is that, normally, with an Embraer, you climb to 3,000 feet, go to speed limit 250 knots and then go towards your cruise Mach; once you’re past 10,000 feet, for the remainder of the climb you can fly at your Indicated Air Speed. In this case you’re adjusting your climb segments in order to have a bit more optimized climb towards your cruise, bearing in mind that your greatest fuel burn is in climb.
THE RESULTS AND THE WAY TO SUCCESS
KLM Cityhopper operates about 9500 flights a month, which are calculated by SITA for OptiClimb and you can see some of the results in figure 11.
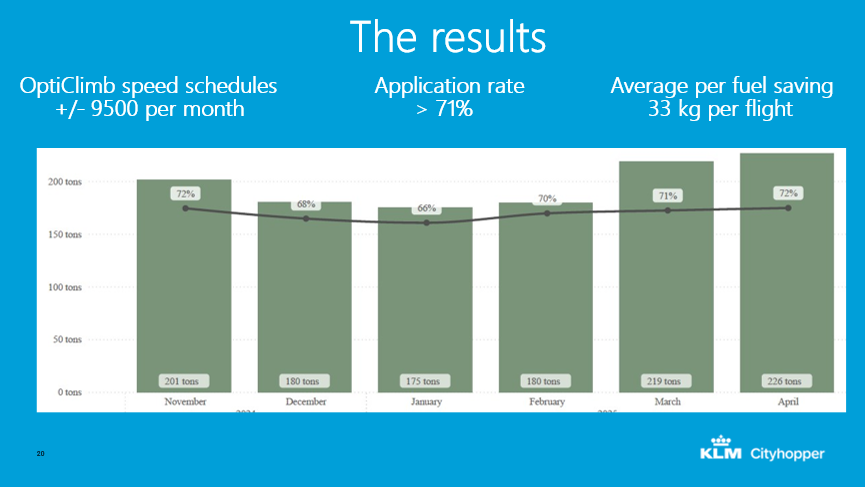
Figure 11
We’re proud that pilots have an application rate of 71% and an average fuel saving of 33 kilos per flight. You can see the results in the figure, it’s quite impressive. Some of those numbers are coming from SITA, and of course, it’s hard to verify, because it’s such a small amount of saving we have. But in our other tools we have, we also see the saving. We cannot make it a 100%, but it’s very close to what’s presented here. Some say that if you’re using OptiClimb, you are an airway blocker because your climb is steeper and your forward movement is slower. However, you can see that even on a busy airport such as Amsterdam, you reach 77% and it’s quite normal here at the moment; everybody uses it. We can see that on some airports where we have special time procedures, we don’t use it but, overall, it’s a good application rate.
The first secret of using it successfully is to make it a standard operating procedure (SOP), as in figure 12.
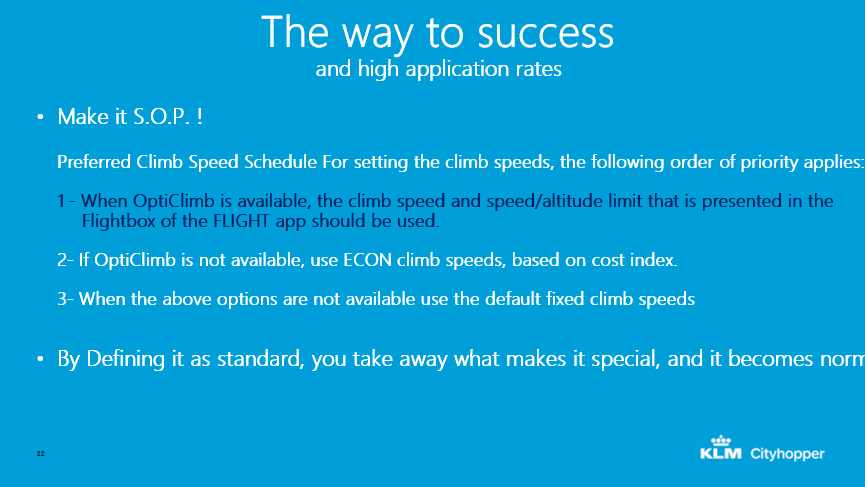
Figure 12
Put it in your books as the time speed schedule for setting time speeds; tell pilots that, “The following order of priority applies when all the time is available, use it.” That’s the secret. Pilots don’t have to ask themselves why they should use it, because it’s standard operating procedures; just do it if you can. That’s the secret of success.
SITA OptiClimb® VALUE PROPOSITION
What’s the value proposition of SITA OptiClimb? It’s summarized in figure 12.
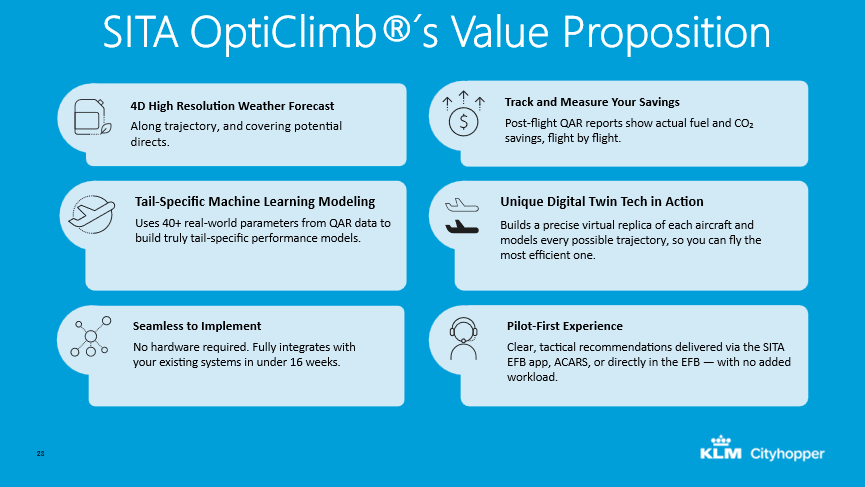
Figure 12
It’s the 4D highly resolution weather forecast they use, the tail specific machine learning models, seamless implementation with the capability to track and measure savings, and there is unique digital twin technology, plus pilot experience is very important. You have to give your pilots information as to why you’re making this change. Also make the results accessible for everybody to know what you’re doing.
eWAS
As well as the adoption and implementation of OptiClimb, we also want to tell you about our experience implementing eWAS in operation and why we chose it in the first place. The need for improved, in-flight weather is probably a familiar topic for most airlines as climate change is making the weather more volatile and less predictable. More and bigger storms, greater frequency of turbulence, heavy thunderstorms, and other undesirable weather phenomena have increased over the past few years. When a flight is unexpectedly confronted by these weather events during flight, incidents can occur that may cause injuries to passengers and/or crew or damage to the aircraft itself. This must be prevented. Little surprise then that there’s more focus on trying to make flying a smooth experience, despite all these different weather phenomena.
The effects of things like turbulence can be considerable. There have been instances in the past where the cabin crew was providing service, snacks and drinks, to the passengers when unexpected turbulence caused them to fall down or even to break an arm. So that’s something we want to avoid and to do that requires quality information which is something that we’ve been missing in the past. We used to supply significant weather charts as in figure 13.
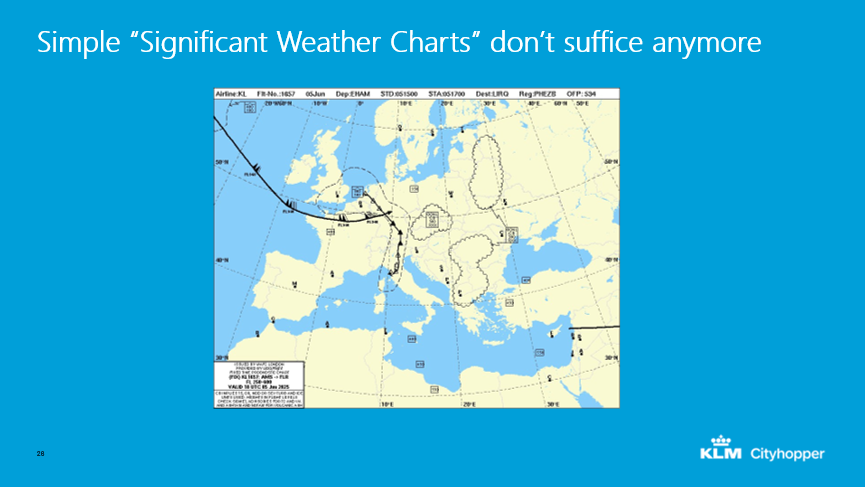
Figure 13
These are very Disability Percentages, but I’m not to pilot for a couple of decades. But, as you might be able to see in the figure, it’s quite difficult to actually take any action based on situations, to truly get a good feel as to where you might be able to expect turbulence or something else; and that’s where actionable information comes in. Figure 14 shows an actual speech of a typical film.
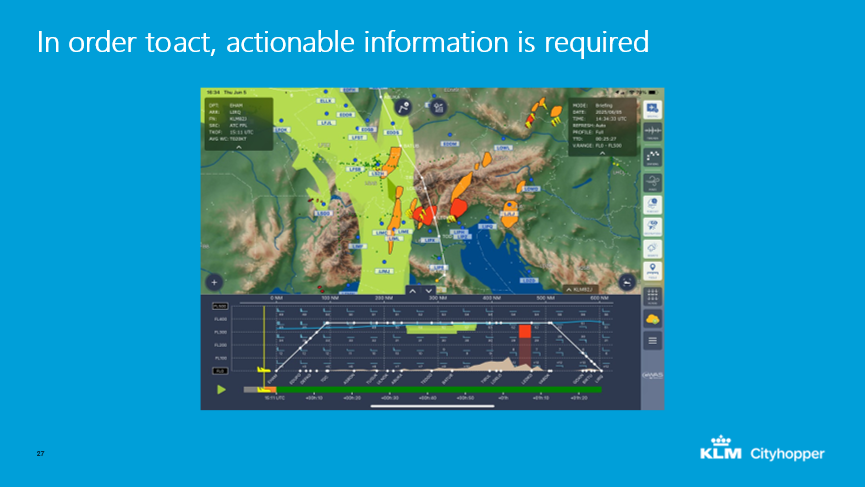
Figure 14
As you can see, the resolution and the type of information that’s presented to pilots from eWAS has quite a lot more detail and more precision as to where the flight might run into bad weather events, and that’s what makes it actionable. I don’t just need to know that there’s turbulence there, I need to know how to avoid it. That’s why something like eWAS is incredibly valuable, because it tells the pilot whether they can go a bit further towards the west of the east or, maybe, just climb a bit or descend a bit and be able to avoid the worst of it. That’s really helping to make better decisions in order to ensure a smooth flight.
CHOOSING THE RIGHT WEATHER APPLICATION
How do you choose the right application for your airline? At KLM Cityhopper, we started by compiling a list of criteria. One of the important ones is, of course that any solution needs to be compliant with the regulations. There’s plenty of weather apps out there and you can just download them: they will tell you all sorts of things about the weather but that doesn’t mean you can use them on the flight deck. They have to be compliant with the regulations and there are a few other needs. Any solution has to be liked by the pilots because otherwise, they won’t use it and it will all have been for nothing. Two other things we were looking for were to keep things as efficient as possible. We were looking for something that has a low data cost as possible, in order to keep mobile rate costs down. We also wanted something that was easy to integrate and, considering those criteria, eWAS was pretty much the only one that met our needs.
One of the things was the ID regulation. One of the requirements we found a bit more difficult for us, was that we need to use a so-called approved letter source here in Europe, and that means everyone just allows use, whether that’s coming from basically anyone, now we need to have to be provided by resource. It’s an EASA requirement and it’s what eWAS gives us today, plus a large range of different weather providers to different weather products. And they allow you to fully customize, fully optimize products in a way that they’re truly reaching the user airline’s needs. We selected Météo-France as a weather provider. Later on, we also added Deutscher Wetterdienst, which could also have been great for us as well, but there are plenty of options. As previously mentioned, we’re very focused on digital turbulence alerts but pilots want to show icing and things like that as well. And that makes for a product that’s used by pilots, because it’s easy to see what’s going on and to adjust the flight with exactly the right amount of information. There’s no overload there. It’s just what you need to know in order to do what is necessary. That was even evident with our trial. We were expecting a couple of pilots to sign up for the trial but, in the end, about 200 pilots volunteered to start using the product, and they all liked it so much that they didn’t want stop using it after the trial.
During the early days of eWAS, In-Flight Connectivity wasn’t a given; it still isn’t for many aircraft to this day. As such, eWAS was designed to be updatable via ACARS. ACARS isn’t designed as a high bandwidth system and therefore required eWAS to use as little data as possible. As a result, the data usage of eWAS has been highly optimized. We mainly update eWAS via the mobile data connection of our iPads. The low amount of data that is required for an update not only makes the update quicker but also helps us save mobile data costs.
eWAS is easy to integrate so that introducing it in our operation was easy. Flights can be added to eWAS via a default integration with Eurocontrol. No custom integration within our existing IT systems was required. The objective was to make sure the pilots were able to download it. There’s an automatic integration of Eurocontrol that’s already taken care of. So, we’re just able to download flights automatically, and we don’t need any interfaces, or assistance. The eWAS app isn’t just available to our pilots, but to our dispatchers as well. This allows for a shared situational awareness and easy cooperation. Pilots were trained and informed using a Quick Start Guide. Most pilots didn’t need the guide, as the app mostly speaks for itself. The complete user guide, as well as detailed legends, are available in the app itself. This makes it easy for pilots to find the answer to any question they may have about the app.
UNEXPECTED BENEFITS
There are also some unexpected benefits that we found in eWAS. Although we were mainly focusing on trying to give pilots information about the weather, turbulence incidence, disturbances to avoid, being stuck on the ground, we found that it’s also a tool that can be used to further optimize the flight. Figure 15 offers a quick example of that.
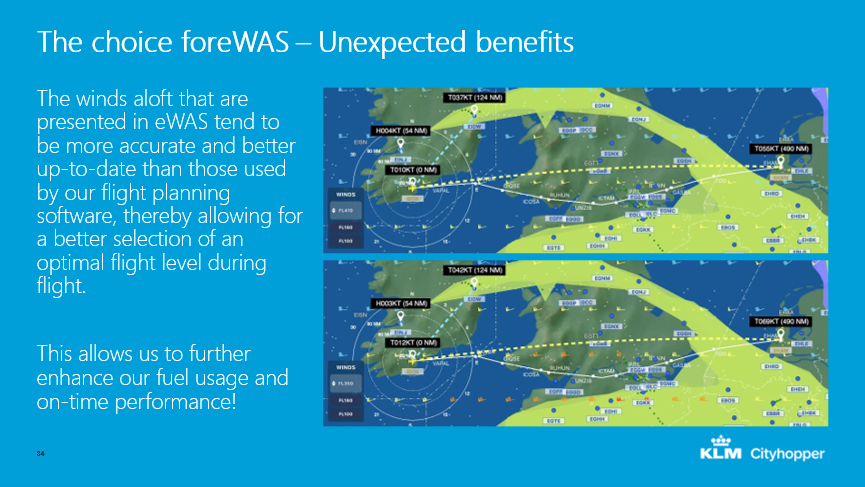
Figure 15
The winds aloft that are presented in eWAS tend to be more accurate and more up-to-date than those used by our flight planning software, thereby allowing for a better selection of an optimal flight level during flight. This allows us to further enhance our fuel usage and on-time performance.
That’s how KLM Cityhopper selected and implemented two key apps that offer us more efficiency climb outs and greater weather awareness to improve fuel efficiency, reduce carbon emissions and minimize weather related incidents and dangers for a smoother flight.
Comments (0)
There are currently no comments about this article.
To post a comment, please login or subscribe.